

$63,000. That's roughly where BTC sits right now, after bouncing overnight from under $60,000 to $64,000, and half of the crypto community is already calling it the bottom. They're wrong. Not maybe wrong. Wrong. And unlike most bottom-callers, we can point to one number that proves it.
Every time Bitcoin pulls back hard, the same chorus starts. Bargain hunters post entry alerts. Influencers dust off their halving cycle charts. Retail money floods in early, gets wrecked, and swears off crypto for six months. The problem isn't bullishness. The problem is confusing a lower price with a confirmed bottom. Those are two completely different things.
Read also: The AI Is Not Predicting a Bitcoin Crash. It Is Predicting You.
A Lower Price Is Not a Bottom. It's Just a Lower Price
A real bottom isn't a price level. It's a regime change. It happens when sellers are exhausted, when the people who needed to sell have sold, and when momentum stops pointing down. None of that is visible in the spot price alone. Bitcoin at $63,000 looks cheap next to recent highs, but "looks cheap" is not a trading strategy. It's the exact thought that got people wrecked at every false floor in 2022.
So instead of arguing about vibes, let's use a measurable line in the sand.
Read also: The AI Industry Needs Power. Bitcoin Miners Already Have It
The One Number That Actually Matters: Weekly RSI 41.5
CoinDesk highlighted it this week, citing analysis from data platform Material Indicators. Bitcoin's 14-week relative strength index has one level that has reliably separated bull regimes from bear regimes across multiple cycles: 41.5.
The track record is hard to argue with. The weekly RSI held above 41.5 through the entire bull run from January 2024 to November 2025. Same story in the 2020 to 2021 cycle, and in 2015 to 2017. On the flip side, the ugliest stretches of every bear market played out below that line: late 2018, May through December 2022, and the past few months.
Where is it right now? At 34.00. Not just below the line, but still trending down. As Material Indicators analyst Keith Alan put it, that doesn't mean price has to collapse, but the burden of proof is on the bulls. Until the weekly RSI reclaims 41.5, every bounce is a relief rally inside a downtrend until proven otherwise.
There's a second number to watch underneath: 31.89, the previous weekly RSI reading. If the indicator breaks below that, the momentum picture says lower prices are still ahead.
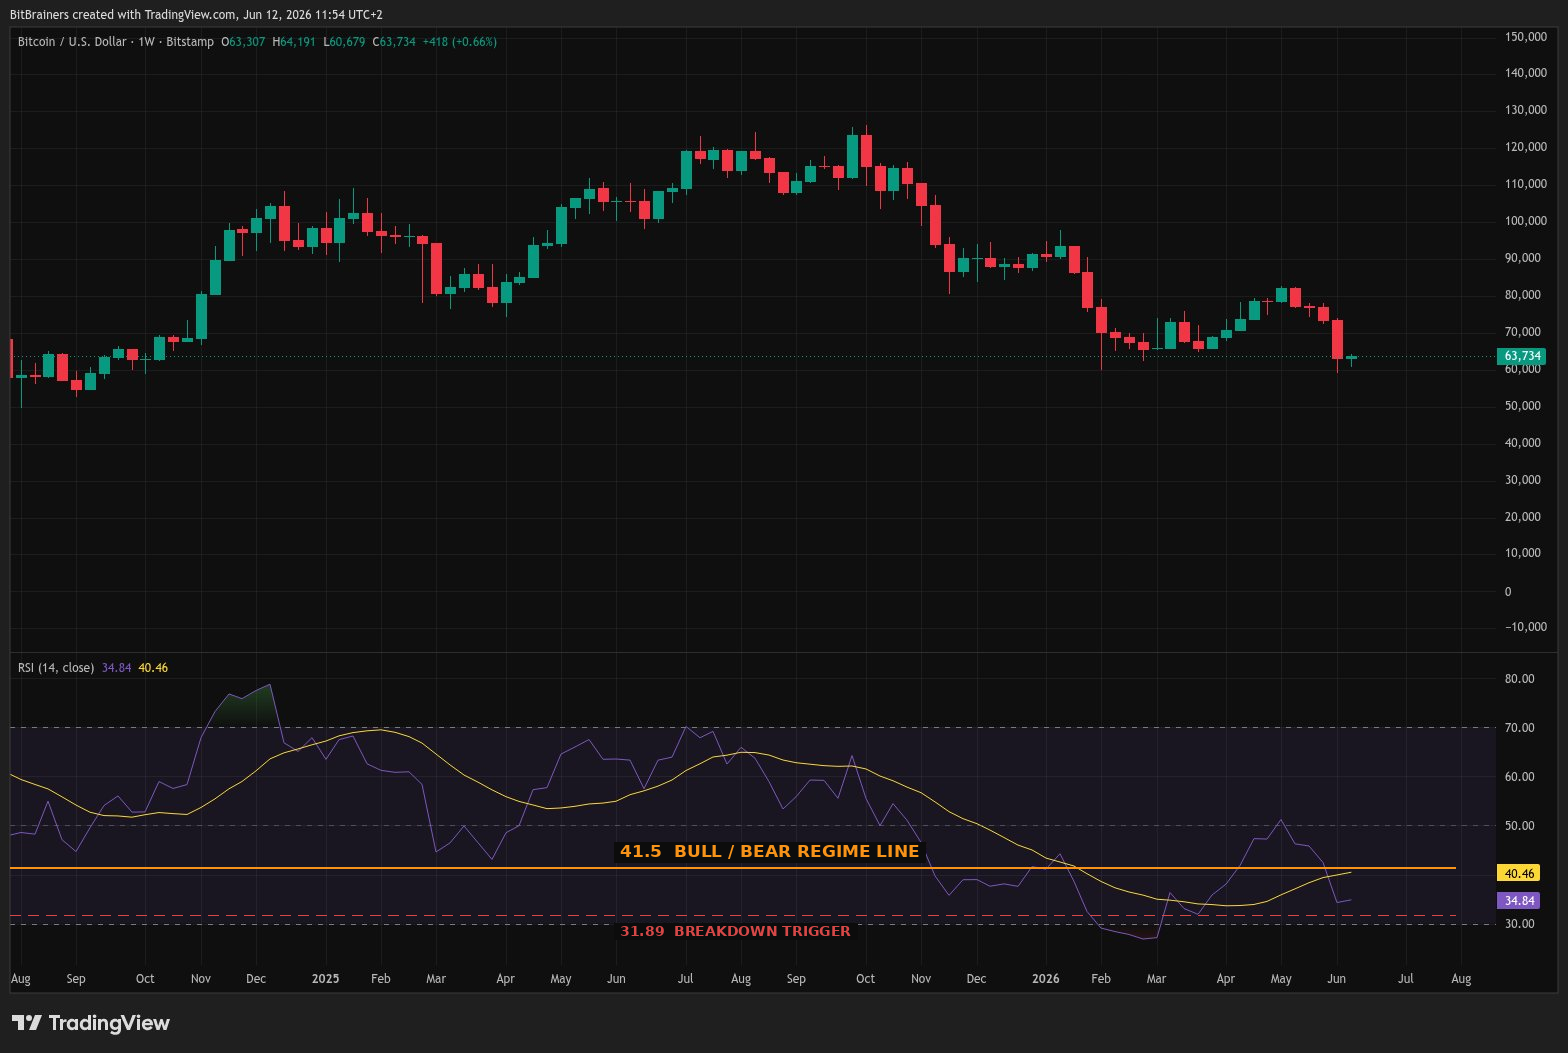
BTC/USD weekly with 14-week RSI. June 2026. RSI at 34.84, below the 41.5 regime line. Source: TradingView
Why Bottoms Never Feel Like Bottoms
Here's the part most crypto blogs skip. The bottom of a Bitcoin cycle rarely feels like a bottom while you're in it. It feels like another bad day. The final capitulation is, by definition, the moment sentiment is worst. Nobody writes bullish threads during genuine capitulation. The forums go quiet.
2022 is the case study nobody wants to remember. The weekly RSI spent May through December of that year below 41.5, and during that entire stretch analysts called the bottom over and over, each time with data to support the case. Each time the market found a new low. The final floor arrived when almost nobody was watching for it, and the bounce caught most people flat-footed.
What you're seeing right now, a price in the $60,000s with an active public debate about whether this is the bottom, is not that. Real bottoms don't come with a public vote.
The Supporting Cast: Miners and On-Chain Flows
Momentum is the headline signal, but it doesn't act alone. Two things tend to confirm a real floor when the RSI finally turns.
First, miner behavior. When price trades below the cost of production for enough of the network, miners shut off machines or sell reserves to cover costs. That forced selling adds pressure on the way down, and when it stops, a sustained source of sell-side flow disappears. This isn't hypothetical right now. Cointelegraph reported that publicly listed mining companies sold more BTC in Q1 2026 than in all of 2025, with the total miner reserve tracked by CryptoQuant grinding down from over 1.86 million BTC at the end of 2023 to about 1.8 million. Analysts at CoinShares expect further capitulation among higher-cost operators through the first half of 2026 unless price recovers materially. In plain terms: a structural source of sell pressure is still active, which is one more reason a durable floor hasn't formed yet.
Second, the transfer of coins from weak hands to strong hands. A genuine bottom prints a spike in realized losses followed by rapid absorption into long-term holder wallets. Heavy loss-taking, then patient accumulation. That combination is the structural signature of a floor, and it requires watching on-chain dashboards, not setting a price alert on your exchange.
What Would Prove Us Wrong
This is where most bottom-isn't-in posts cheat. They never tell you what would change their mind. So here it is, in one sentence: if the weekly RSI closes back above 41.5, the bottom call gets real and this post is outdated. That's the confirmation signal, and we'll say so when it triggers.
Until then, the math on waiting is better than people think. Being early into a bottom isn't smart trading. It's being wrong with extra steps. You sit in a losing position, you anchor to your entry, and you start making decisions based on what you need the price to do instead of what the market is doing. The traders who consistently profit from bottoms wait for confirmation, pay a slightly higher price, and ride a move that has already proven itself.
If you're holding BTC through this stretch either way, make sure your security is sorted before the volatility, not after. A hardware wallet from Trezor keeps your coins genuinely yours while you wait out the noise.
Stop Watching the Number. Watch the Regime
You probably came into this post asking whether $63,000 is the right price to buy. Wrong question. The right question is whether the market has switched regimes, and there's a single, public, free-to-check indicator that answers it. Price is an output. Momentum regime is the input. Until the weekly RSI clears 41.5, the input hasn't changed, and the output will keep disappointing the people who focused on price alone.
On The Radar This Week
Bitcoin is trading near $63,000 after dipping below $60,000, and the next meaningful floor sits at $62,500. A clean break below that opens a larger leg down, and nothing in the current flow data argues against it. US spot Bitcoin ETFs just posted a record nine-day outflow streak in late May, roughly $2.8 billion exiting the funds, the longest stretch of redemptions since they launched in January 2024. That is not the signature of a market finding its footing.
The macro calendar is doing Bitcoin no favors. The BOJ rate decision lands June 15 to 16 with markets pricing a hike to 1.0%, a 31-year high, and the real signal to watch is USD/JPY on the evening of June 14 UTC. A stronger yen historically tightens global liquidity and pressures risk assets, Bitcoin included.
On the regulatory side, the CLARITY Act keeps advancing through the Senate with a summer vote on the horizon, the one genuinely constructive variable in the mix. The tokenized Treasury market crossing $1.5B AUM signals where institutional capital is parking itself, and it is not in spot Bitcoin. Watch $62,500 as the line that separates a shakeout from a structural breakdown, and watch weekly RSI 31.89 as the momentum equivalent.
Sources
CoinDesk. There's one simple way to tell whether bitcoin has really bottomed. Right now, it hasn't.
CoinDesk. Bitcoin ETFs suffer record 9-day outflow streak as $2.8 billion exits funds
Cointelegraph. Major Bitcoin Mining Companies Sold More BTC in Q1 2026 Than All of 2025
BitBrainers. We check the facts so you don't have to.
Disclosure: This post contains affiliate links to Trezor. BitBrainers may earn a commission at no extra cost to you. This is not financial advice.
— BitBrainers Editorial


