₿ BTC Loading... via Binance
Showing posts with label Weekly Brief. Show all posts

Monday, August 24, 2026

Weekly Brief: Bitcoin Just Broke a Two-Month Range. Here Is What Matters This Week.

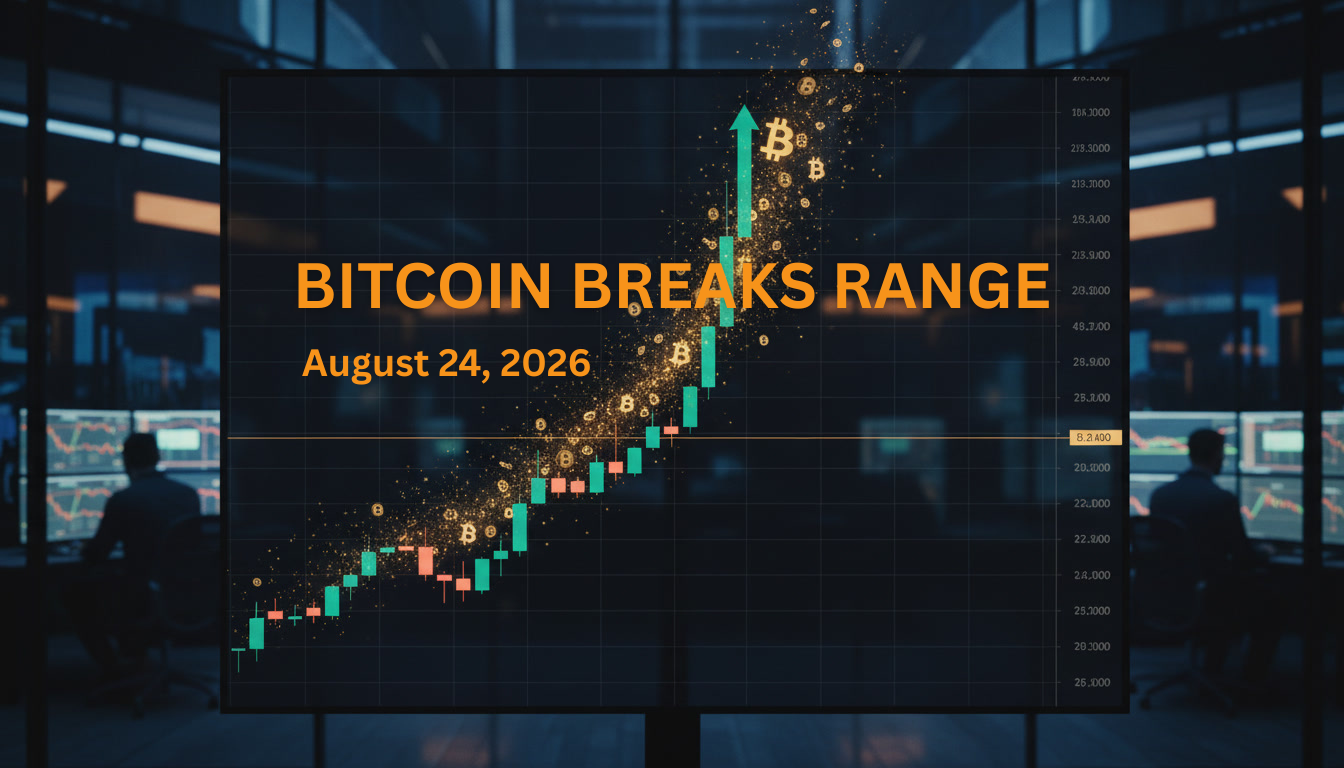
Bitcoin breakout - Weekly Briefing August 24 2026

By BitBrainers Editorial

Bitcoin broke a two-month range with a 24% weekly candle. The Treasury buyback was the match. The squeeze did the rest. The ETFs are the follow-through. This is what institutional accumulation looks like when it finally shows up.

What happened

Bitcoin surged from $62,000 to nearly $80,000 in four days. ETF inflows hit $2.4 billion month-to-date. BlackRock's IBIT captured $284.7 million on August 19, $503 million on August 20, and $239.3 million on August 21. Eight of twelve ETFs saw inflows.

Then the pullback came. BTC gave back $3,000 from the high and is now testing whether the breakout holds. Volume dropped from $74 billion to $32 billion. The forced buying stopped. The market is waiting for the next catalyst.

What matters this week

Jackson Hole Economic Policy Symposium, August 27–29. Chair Kevin Warsh delivers his first keynote as Fed chair on Friday, August 28. Markets are pricing hike-or-hold odds close to even for the September 16 FOMC decision.

Also: BitMart trading halt on August 26 at 01:00 UTC.

What is inside the Weekly Briefing

The full PDF covers the levels that matter this week, the derivatives reset, the liquidation heatmap, the on-chain picture, and a positioning note with exact entries and targets.

Get the Weekly Briefing

Market structure, key levels, on-chain signals, positioning notes. Delivered Monday as a PDF.

Subscribe

Tools: Kraken for trading. Trezor for storage.

This is market commentary, not financial advice. Nothing here is a recommendation to buy or sell any asset. Do your own research.

Just want alerts when we publish? Join free →

Monday, August 17, 2026

The FOMC Cheat Sheet: Three Charts That Matter Before Every Fed Meeting

The FOMC Cheat Sheet: Three Charts That Matter Before Every Fed Meetings

Every FOMC decision moves Bitcoin within minutes of the release. The problem is that most traders watch the headline rate and miss the three signals that actually determine the direction. This cheat sheet fixes that.

I built it after seven years on a regulated desk where the difference between a profitable macro read and a losing one was knowing which data points the Fed itself watches. The desk did not trade on the headline. The desk traded on the divergence between the headline and the underlying signals. This sheet does the same thing for Bitcoin.

What the Cheat Sheet Covers

1. The PCE Print

The Fed does not watch CPI. The Fed watches core PCE. The cheat sheet breaks down the month-on-month and year-on-year prints, flags the direction versus consensus, and scores whether the print is hawkish, neutral, or dovish for risk assets. It also notes the energy base effect, which is the single most common reason why a "soft" CPI print is actually meaningless.

2. ETF Flows

Institutional money does not move on Fed day. It moves in the weeks before, and the ETF flow data shows you exactly where it is going. The cheat sheet tracks BlackRock IBIT, Fidelity FBTC, and the aggregate category flows. It flags concentration risk (when 80% of inflows go to one fund, the category is fragile) and reversal patterns (five-day inflow streaks that end in single-day outflows are not conviction, they are rotation).

3. The Dissent Count

The FOMC vote is not always unanimous. When members dissent, the minutes reveal how close the committee came to a different decision. The cheat sheet tracks the dissent count, the direction (hawkish or dovish), and the historical pattern of what happens to Bitcoin when the Fed is divided versus when it is unified. A 9-0 vote means the market already knows the path. A 7-2 or 9-3 vote means the path is contested, and contested paths create volatility.

How to Use It

Score each of the three signals before the meeting. Add the scores. A combined read of +3 or -3 gives you directional conviction. A combined read of 0 or +1 means the market is priced for confusion and you should size down. The cheat sheet fits on one page. You can print it, save it to your phone, or tape it to your monitor. I have seen traders do all three.

Who This Is For

This is for people who are tired of guessing which way Bitcoin breaks after a Fed decision. It is for holders who want to know whether to add, reduce, or do nothing. It is not for day traders looking for a scalping edge. The cheat sheet gives you a framework, not a signal.

Download the Cheat Sheet

The FOMC Cheat Sheet is free. One page. No email required. No upsell. Just the three charts that matter.

Download the Free FOMC Cheat Sheet

Want more? I write a weekly Bitcoin briefing for people who care about macro, not memes. One email. Every Monday. Key levels, derivatives positioning, on-chain signals, and the macro events that matter for the week ahead.

BitBrainers Weekly Briefing — $9/month, cancel anytime


Buy Bitcoin on Kraken — the exchange we use for spot purchases.

Store it on Trezor — hardware wallet, offline, no counterparty risk.

These are affiliate links. We only link to products we use.

This is market commentary, not financial advice. Nothing here is a recommendation to buy or sell any asset. Do your own research.

Weekly Brief: Bitcoin Range-Bound at $63,400 Ahead of Wednesday FOMC Minutes
Weekly Brief: Bitcoin Range-Bound at $63,400 Ahead of Wednesday FOMC Minutes

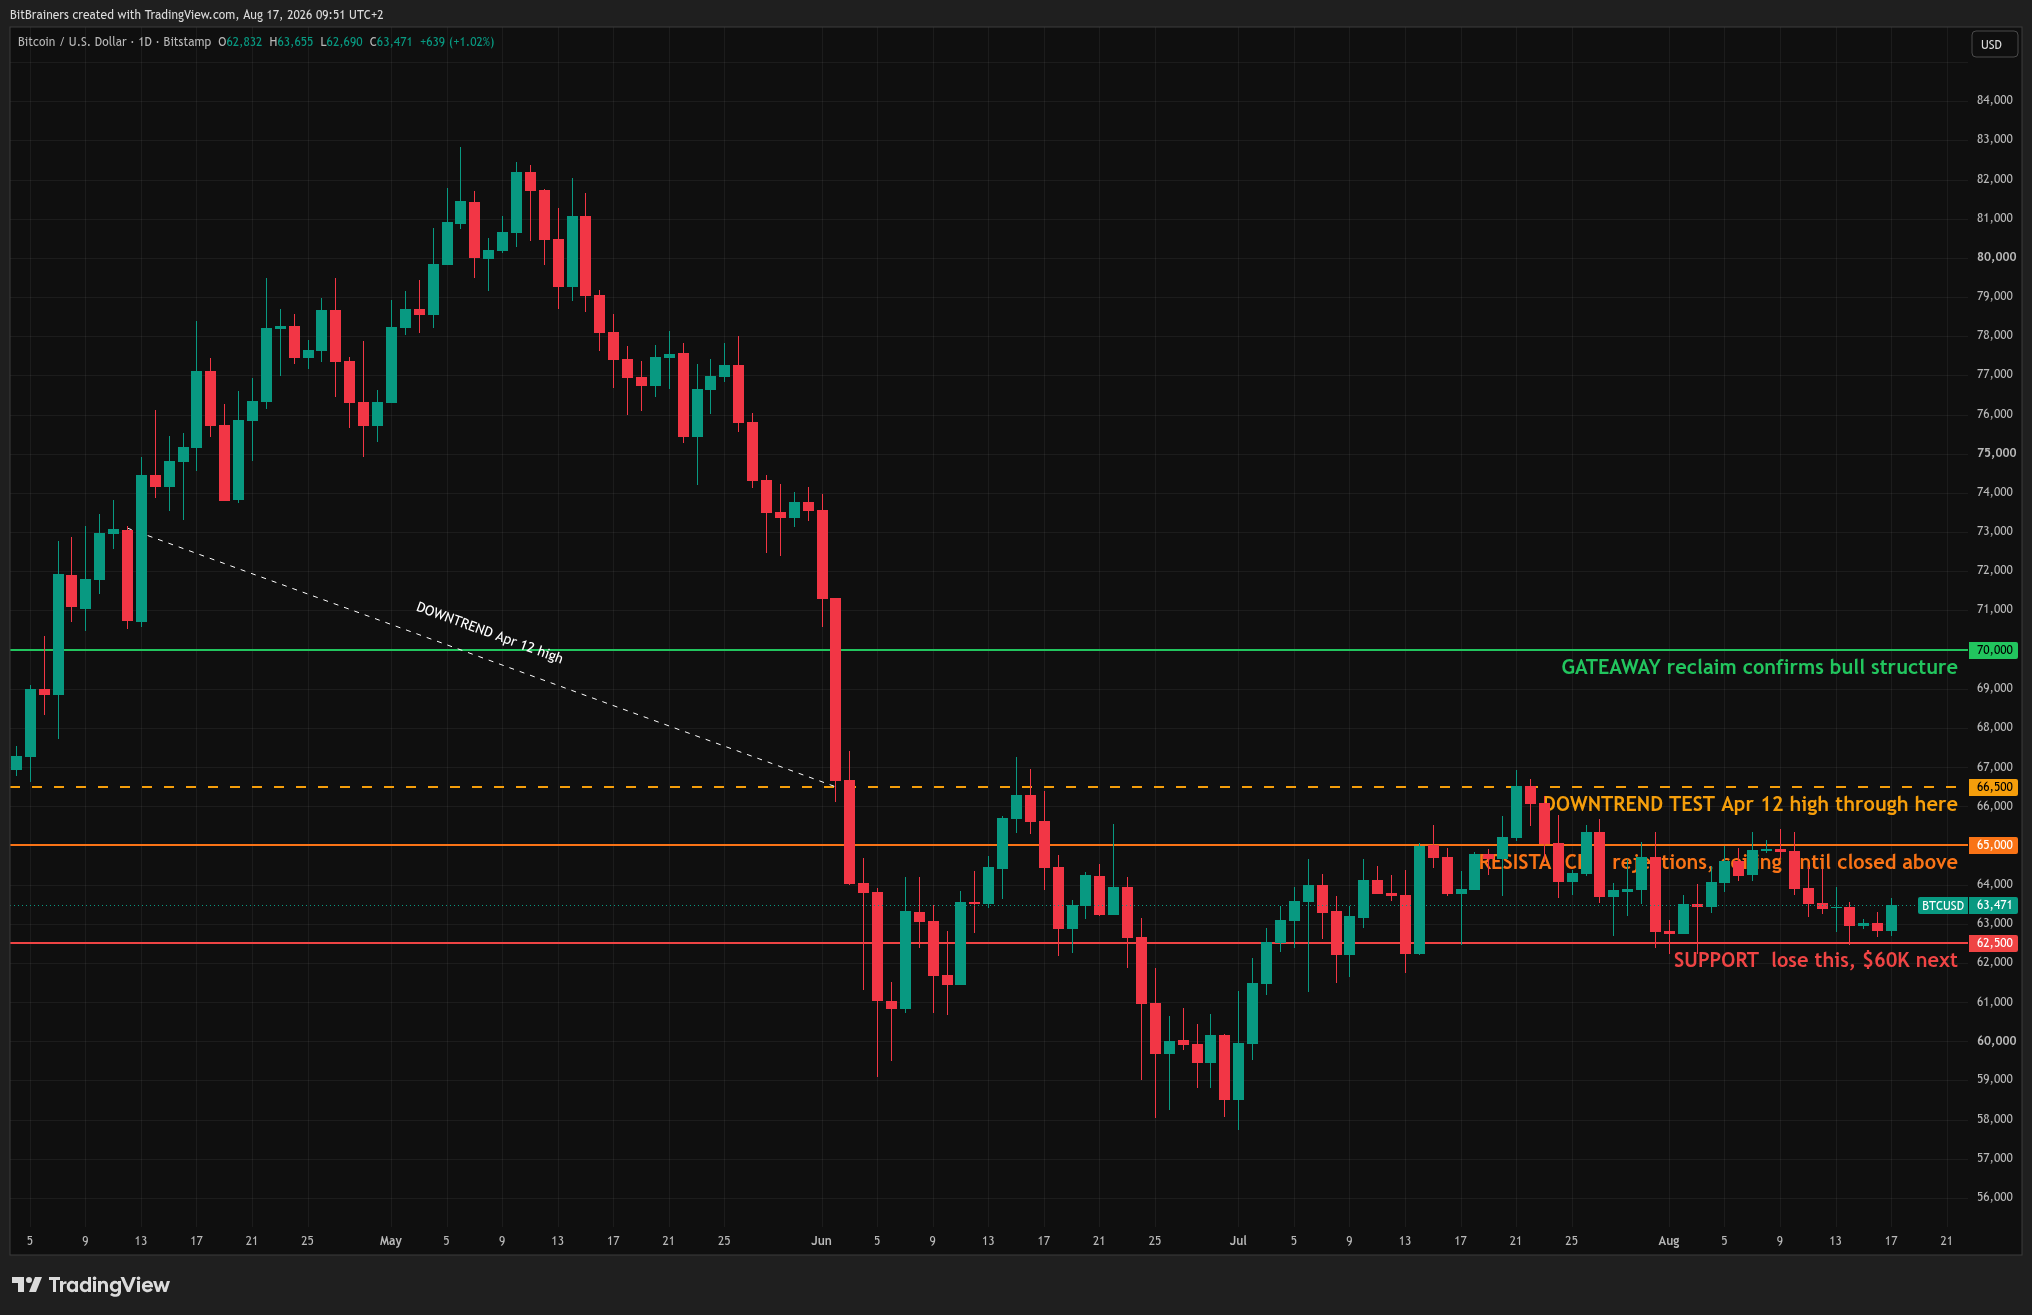
Bitcoin daily chart August 2026 showing compression between $62,500 support and $65,000 resistance.

By BitBrainers Editorial

Bitcoin has spent eleven days inside the same $62,600–$65,000 range and the market is waiting for Wednesday's FOMC minutes to provide a directional catalyst.

Support at $62,600 has been defended multiple times over the past two weeks. Resistance at $65,000 has produced three separate rejections. The structure is clean compression, not distribution.

The derivatives picture shows de-risking rather than bearish positioning. Open interest declined over the past week while price stayed flat. Funding rates are moderate. The market is not crowded long and not aggressively short. It is waiting for a macro trigger.

That trigger arrives Wednesday at 2:00 PM ET, when the Federal Reserve releases the minutes from its July 28–29 meeting. Three members dissented in favor of a rate hike. The language in those minutes around inflation, the neutral rate, or September guidance will move risk assets within minutes of release.

For holders, the priority is whether the $62,500 floor holds through the FOMC release and into the Jackson Hole symposium next week. If it does, the next test is $65,500. If it does not, the correction extends toward $60,000.

The full breakdown of this range, including the annotated TradingView chart with the four key levels, the Coinglass liquidation heatmap showing the $1.1 billion long exposure below $65K and the $750 million short cluster above $68K, the open interest and funding rate analysis, the Deribit Max Pain data for the September quarterly, the ETF flow breakdown with IBIT concentration data, and the complete macro calendar through Jackson Hole, is available in this week's BitBrainers Weekly Briefing.

Get the Weekly Briefing — $9/month, cancel anytime

Tools: Kraken for trading. Trezor for storage.

This is market commentary, not financial advice. Nothing here is a recommendation to buy or sell any asset. Do your own research.

Monday, August 10, 2026

Weekly Brief: The Number That Decides September

By BitBrainers Editorial

The July CPI report is scheduled for August 12 at 8:30 AM ET. It is the next input that moves September FOMC pricing. Bitcoin is at $65,212 with $65,800 as the weekly resistance. Whether that level breaks depends on what Wednesday says.

Why This CPI Print Is Different

June CPI came in at 3.5% year-on-year. The month-on-month reading fell 0.4%, mostly because energy prices dropped 5.7% in June. That tailwind is gone.

The Iran conflict pushed oil back up through July, and markets are expecting the month-on-month reading to turn positive again. Consensus sits around 3.5% year-on-year for headline, with core near 2.6%. The issue is not the number itself. It is the direction.

A positive month-on-month print, even a small one, shifts the narrative from cooling to reaccelerating. The Fed is watching that, not the headline. After July's jobs report missed badly, September hike odds fell. CME FedWatch now prices a hold at 60% and a hike at 40%. Wednesday resets that in one direction or the other.

CME Futures Positioning Flipped

Hedge funds have moved to net long on CME Bitcoin futures, according to the CFTC Commitments of Traders report. That is a structural shift. These are positions built over weeks, not sentiment readings that reverse overnight. One CPI print does not unwind that positioning. What it does is delay or accelerate the next move.

Leveraged funds also cut their net short Yen positions by 74,000 contracts in five weeks, per CFTC data reported by The Kobeissi Letter. The Kobeissi Letter described it as one of the sharpest reductions in short positioning since the 2008 Financial Crisis.

The last time Yen carry dynamics unwound at scale, August 2024, BTC dropped to $49,000 in days. The current unwind is slower. That is not the same as safe.


Jackson Hole Is the Next Real Signal

The September 16 FOMC is not the only event shaping the rate path. Fed Chair Kevin Warsh speaks at Jackson Hole on August 27-29. The symposium theme this year is "Financial Innovation: Implications for Payments and Policy." That theme is unusually relevant to crypto under a new Chair.

His speech will be the final pricing input before the September decision. Between now and then: July CPI on August 12, July PPI on August 13, and July PCE on August 26. Three inflation prints in 14 days, then Warsh.

Key Levels This Week

BTC at $65,212 entering August 10. Resistance at $65,800. Support at $62,000, then $58,000 as the macro floor.

10-year Treasury yield near 4.70%. A move above 4.80% post-CPI tightens financial conditions further. Fed September hike odds: 40% as of today.

For the macro setup behind the liquidity picture: Bitcoin Follows M2 With a Lag Nobody Talks About

The Week Ahead

Date Event Why It Matters
Wed Aug 12 July CPI, 8:30 AM ET Consensus 3.5% YoY. Month-on-month turning positive reaccelerates the hike narrative.
Thu Aug 13 July PPI Leading indicator for CPI. Shows how inflation moves through the supply chain before it hits consumers.
Mon Aug 26 July PCE Fed's preferred inflation gauge. Core PCE above 3% strengthens the September hike case.
Aug 27-29 Jackson Hole Symposium Warsh speaks. Final pricing input before the September 16 FOMC.
Sep 16 FOMC Decision Hold at 60%, hike at 40% as of today. Every print between now and then moves that needle.

For last week's setup: Weekly Brief: July Closed Green. August Has a Record to Defend


Monday Morning. Every Week.

The macro data and Bitcoin levels that matter this week, before the week starts.

Subscribe

Sources

CFTC Commitments of Traders Report, week ending August 4, 2026

The Kobeissi Letter Hedge Funds Cut Short Yen Positions By Half

CME Group FedWatch Tool, September FOMC Probabilities

US Bureau of Labor Statistics Consumer Price Index Release Schedule, July 2026

Federal Reserve Bank of Kansas City Jackson Hole Economic Policy Symposium 2026

CNBC Odds of Fed Rate Hike Tumble Following July Jobs Miss

Tools We Use

Kraken: Spot and futures on BTC, ETH, and 200+ assets.

Trezor: Cold storage. No internet connection required.

This is market commentary, not financial advice. Nothing here is a recommendation to buy or sell any asset. Do your own research.

Monday, August 3, 2026

Weekly Brief: July Closed Green. August Has a Record to Defend

By BitBrainers Editorial

Bitcoin closed July at roughly $63,000, up about 7% for the month. That makes three consecutive green Julys, a streak no other month can match. August arrives with the worst seasonal record on the board, a CLARITY Act that just lost its Senate floor window, and an ETF flow picture that flipped back to red in the final week of the month. The range from early July is still intact. Whether it holds is the only question that matters this week.

July Ended Green. August Has Never Been Kind.

Bitcoin held the $60,965 floor through July and closed near $63,000. The month printed green for the third consecutive year, which is genuinely rare. Seasonal data going back to 2013 shows August closing red more often than any other month, with a median loss around 8%.

That context does not make a down August inevitable. It does put the burden of proof on the bulls. A three-day close above $66,885 invalidates the bearish seasonal framing and opens a path toward $76,000. Losing $60,965 on a three-day close starts a different conversation, with the $54,000 zone as the next technical reference.

The range has held since early July with no break in either direction on real volume. Until that changes, the range is the trade.


ETF Flows: Three Weeks Up, Then a Friday Flush

Spot Bitcoin ETFs ran three consecutive weeks of net inflows through late July, roughly $306 million across the streak. That reversed June's $4.5 billion outflow month, the worst since the funds launched in early 2024.

The final week broke it. Net outflows hit $61.53 million for the week ending July 31, driven by a sharp move on the last trading day. Fidelity's FBTC led redemptions at $85.19 million. Grayscale's GBTC shed another $52.63 million.

BlackRock's IBIT was the outlier, posting $869.02 million in weekly inflows against the broader red tape. IBIT keeps functioning as the institutional anchor, but even that inflow could not offset redemptions across the rest of the product set.

Three weeks of inflows followed by one red week is not a trend reversal. It is a data point worth watching as August opens.


Flows over noise, every week.

The macro and Bitcoin read that skips the hopium and shows the data.

Subscribe

CLARITY Act: The Window Closed Without a Vote

Senate Majority Leader John Thune confirmed last week that the CLARITY Act will not get a floor vote before the recess. The bill is not dead, but the calendar now works against it in ways it did not in February.

The updated merged text dropped on July 22 at 616 pages, combining the Senate Banking and Agriculture drafts and adding ethics provisions barring covered federal officials from issuing or sponsoring digital assets while in office. Democrats had demanded those provisions for months. The compromise arrived too late for a floor calendar already consumed by a Russia sanctions package and a backlog of nominations.

Polymarket odds on the CLARITY Act becoming law in 2026 have fallen to roughly 28%, down from 82% in February. The bill passed the House in July 2025 with 294 votes and cleared the Senate Banking Committee in May. It has not received a full Senate floor vote. Missing August does not kill it, but it pushes the next realistic window into a fall calendar crowded by election-year politics and must-pass appropriations.

The market impact runs through what stays in place without it. The SEC and CFTC's March 17 joint guidance, classifying 16 digital assets under a five-category taxonomy, remains the operating framework. That guidance can be rescinded by any future administration without a congressional vote. A statute cannot. The longer the bill waits, the longer that reversibility sits under every institutional allocation decision.


The Fed Held. Jackson Hole Is the Next Real Signal.

The FOMC voted 9-3 to hold rates at 3.50% to 3.75% on July 29. Three officials dissented in favor of a hike. Fed Chair Kevin Warsh again withheld forward guidance in the post-meeting statement, consistent with his strategic-ambiguity approach.

The PCE price index released July 31 showed continued cooling, which softened rate-hike expectations at the margin. But three dissents on a hold is not a committee drifting toward cuts. The next FOMC is September 15 to 16. Warsh speaks at Jackson Hole on August 27 to 29, and that speech is the next real read on direction.

Bitcoin barely reacted to the hold. That tracks with how the market has treated Fed decisions all year. The live sensitivity sits in ETF flows and the legislative calendar, not the rate line itself.


Key Levels This Week

Bitcoin near $63,000 entering August 3. Support at $61,400 and $59,070. Resistance at $64,567, with $67,172 as the next target if reclaimed on volume. The $60,965 weekly floor is the structural line.

Price sits below the 20-day moving average inside a descending channel. ETH trades near $1,865 with supports at $1,807 and $1,717. XRP at $1.06, near its own channel support around $1.05.

None of the three have confirmed a breakout. All three are watching the same variables: the jobs print, ETF flows, and whatever the Senate does before it leaves town.


The Week Ahead: Dates That Matter

This is a calendar-heavy week where the macro prints and the Senate clock overlap. The dates below are the ones capable of moving price.

Date Event Why It Matters
Mon Aug 3 Senate floor opens Published schedule lists only a spending-bill vote. No CLARITY Act action.
Wed Aug 5 Cloture filing deadline Last day to file ordinary cloture for a Friday procedural vote on CLARITY.
Fri Aug 7 July NFP, 8:30am ET Consensus around 87,500 vs June's 57,000. Below 100K prices in a September cut. Above 150K pushes yields up.
Fri Aug 7 CLARITY recess cutoff Practical last chance for a 2026 Senate vote before the break.
Mon Aug 10 Senate recess begins State work period starts. Legislative window for crypto closes until fall.
Wed Aug 12 July CPI First inflation read after the July hold. Feeds directly into September rate positioning.
This week Palantir, AMD earnings Read as AI-demand signals. Palantir consensus is $1.81B revenue, up 81% YoY.

Beyond this week, Warsh speaks at Jackson Hole on August 27 to 29, and the next FOMC lands September 15 to 16. Both sit outside the immediate window but frame the back half of the quarter.

For last week's setup and what we were watching heading in: Weekly Brief: The Week the Market Celebrated Too Early


Sources

CaptainAltcoin Bitcoin Spot ETFs End Inflow Streak, Week of July 27-31

US Bureau of Labor Statistics Employment Situation Release Schedule, July 2026

CryptoNews CLARITY Act Senate Delay Drops 2026 Odds to 35%

CryptoSlate CLARITY Act Vanishes From Monday's Senate Schedule

CryptoRank Bitcoin, Ethereum and XRP Price Prediction for August 2026

CNBC Stock Market Next Week: Outlook for Aug. 3-7, 2026

BeInCrypto Bitcoin Price Prediction for August 2026: Whales Bet Against a 4-Year Losing Streak

Tools We Use

Kraken — Spot and futures on BTC, ETH, and 200+ assets.

Trezor — Cold storage. No internet connection required.

This is market commentary, not financial advice. Nothing here is a recommendation to buy or sell any asset. Do your own research.

Friday, July 17, 2026

Weekly Brief: The Week the Market Celebrated Too Early

By BitBrainers Editorial

Bitcoin opened the week at $63,587, slid to a low of $61,481 on July 8 as Middle East tensions flared, then ripped to $65,000 on Tuesday when CPI came in soft. By Thursday July 17 it is back at $62,735. The week looked like a recovery. It ended where it started.

The CPI Print That Wasn't What It Looked Like

June headline CPI came in at 3.5% against a 3.8% forecast. Core landed at 2.6% versus 2.8% expected. Both missed below. Bitcoin jumped 3.8% to $64,434 and Ethereum rose 6.1% in the same session.

The problem is what drove the soft headline. Gasoline fell sharply in June after the US-Iran ceasefire took hold and oil pulled back. That ceasefire collapsed on July 8. WTI crude has since recovered toward $74 a barrel. The June data captured a world that no longer exists by the time markets traded on it.

Core CPI at 2.6% is a genuine improvement from May's 2.9% reading. But the Fed's actual target is core PCE, and nine of eighteen FOMC officials still project a rate hike before year-end. The July 28-29 meeting is live with no forward guidance, and the soft print shifts odds without changing the structure.


ETF Flows: One Day of Green in a Red Quarter

The CPI reaction produced one day of ETF inflows: roughly $197 million on July 14, ending a 10-day outflow streak. By some measures the single-day figure reached $265 million across all products. Either way, it was the strongest inflow session since May.

Context matters here. June saw $4.5 billion in ETF outflows, the worst monthly figure since the funds launched in early 2024. Year-to-date outflows remain deeply negative. One session recovered a few percent of the capital that left in June alone.

BlackRock's IBIT held approximately $60 billion in assets under management through the week, but BlackRock's broader digital assets AUM had fallen roughly 40% year over year to $49 billion. Citigroup had already cut its 12-month Bitcoin target from $112,000 to $82,000 and revised its 12-month ETF inflow assumption to zero.


The data before the crowd reads it.

Weekly macro and Bitcoin analysis. No price targets pulled from thin air.

Subscribe

Strategy Keeps Selling

Michael Saylor's company filed its weekly disclosure showing 3,588 BTC sold for $216 million during the week of June 30 to July 5, at an average of roughly $60,000 per coin. The company's cost basis across its entire stack sits at approximately $75,476 per coin. It is selling below cost.

The mechanism is straightforward: preferred stock dividends now exceed $1.5 billion annually and must be paid regardless of where Bitcoin trades. The first post-2022 sale was 32 coins in early June. The following disclosure was 3,588 coins. The pace is accelerating.

Strategy is the company whose founder told the world to never sell Bitcoin. The filings now show it sells every week. The two facts are not contradictory once you understand the capital structure. They are worth understanding before repeating either talking point.


CLARITY Act: The Hearing Happened, The Vote Has Not

The House Financial Services Committee held a field hearing in New York on July 17, exactly one year after the House passed the CLARITY Act 294-134. The hearing had no vote attached. Its purpose was to apply pressure on the Senate before the August recess closes the window.

The Senate math has not moved. The bill needs 60 votes for cloture. Republicans hold roughly 53 seats. Two Democrats, Ruben Gallego and Angela Alsobrooks, voted it out of the Banking Committee in May but both remain conditional. Five or more additional Democratic votes are needed and none are publicly committed.

Senator Lummis has said plainly that failure in 2026 likely pushes the next realistic window to 2030. Stifel's analyst Brian Gardner has written that the bill needs to clear the Senate before the August recess or prospects deteriorate materially. The GENIUS Act stablecoin rulemaking deadline of July 18 lands this week and may produce additional regulatory headlines.

For last week's full macro setup and what we were watching heading into this week: Bitcoin Weekly Brief: July 6


Key Levels This Week

Bitcoin at $62,735 on July 17. Weekly range: $61,481 low to $65,000 high. The Bollinger midband sits near $62,015 and the upper band near $65,652, with price compressing back toward the midline after the CPI spike. MACD histogram remains positive. RSI(6) at 62.5, RSI(24) at 49.1.

The $60,000 zone held twice this month. The $65,000 level rejected twice. Until one of those breaks on meaningful volume, the range is the structure.


On The Radar Next Week

July 28-29 FOMC. That is the main event. No forward guidance, no fresh dot plot until September, and the Fed walking in with one soft CPI print against a backdrop of recovering oil prices and an unresolved Hormuz situation. Watch the statement language for any shift in the hike-or-hold bias.

ETF flows daily. A second and third consecutive inflow day led by IBIT changes the picture. A reversal confirms the CPI session as a one-day relief bounce.

Strategy's weekly filing. If the pace continues accelerating from 32 coins to 3,588 coins in five weeks, the math on their dividend schedule suggests this is not a one-off.

CLARITY Act Senate calendar. Any announcement of a floor vote date before the recess, or the absence of one, is the binary that matters for the rest of July.


Sources

Caleb and Brown Weekly Rollup July 14, 2026

CoinStats Bitcoin Daily Market Analysis July 16, 2026

CryptoTicker Bitcoin's Green July Is Real, But One Vote Could Blow It All Up

Yahoo Finance What Happens to Bitcoin and Crypto If the CLARITY Act Misses Its Deadline

Motley Fool Crypto Market Today July 14: Ethereum Soars 6% on Cooler Inflation Data

This is market commentary, not financial advice. BitBrainers holds Bitcoin and other digital assets. Nothing here is a recommendation to buy or sell any asset. Do your own research.

Monday, July 6, 2026

Bitcoin Weekly Brief: July 6 — The President Made $1.2 Billion From Crypto. The Senate Noticed.

By BitBrainers Editorial

Good Monday morning. Bitcoin is trading near $63,252, up about 1.5% on the day, with the Fear and Greed Index at 22. The Senate is still on recess, the Fed does not meet for another three weeks, and the biggest crypto story of the week came from a 927-page ethics filing rather than a chart.

That filing is going to follow the market into July. Here is why.

Where Bitcoin Sits This Morning

Bitcoin spent last week clawing back from a 21-month low under $58,000 and is now pressing the low $63,000s. The bounce came on two things: a weak June jobs report that showed just 57,000 new payrolls, and the first green ETF day in two weeks.

The level that matters is still $63,800. Multiple analysts have flagged it as the point where the downtrend structure breaks — specifically, where Bitcoin clears the lower high from the June decline and changes the technical picture from a series of lower highs to something more constructive. Price is roughly $550 below it as of this morning, close enough that one decent catalyst closes the gap.

Context matters here. Late June gave us the first weekly close below the 200-week moving average since 2023, a line Bitcoin has only lived under during the worst stretches of past bear markets. A recovery from that kind of technical damage needs follow-through, not one good week.

The 927 Pages Hanging Over the CLARITY Act

On Tuesday the Office of Government Ethics released President Trump's annual financial disclosure. It runs 927 pages, one of the longest ever filed by a sitting US president, and it reports more than $1.2 billion in crypto-related income for 2025.

The breakdown: $635 million in royalties from a group called "Celebration Coins" tied to his memecoin business, and over $526 million from sales of cryptocurrency tokens tied to World Liberty Financial, the crypto firm co-founded by members of his family. The White House says there are no conflicts of interest. Senate Democrats spent Wednesday saying otherwise, loudly.

Why this matters for price: the CLARITY Act, the market structure bill the entire US crypto industry has been waiting on, is stuck in the Senate on exactly one unresolved dispute. The ethics provision covering government officials holding personal crypto. The president just filed a public document showing he earned more from crypto last year than most exchanges did.

The Senate returns from recess on July 13 with roughly three working weeks before the August break. The disclosure hands Democrats fresh ammunition for the ethics fight at the worst possible moment for the bill's timeline. If CLARITY does not advance before recess, it slides toward 2027, and the market knows it.

The Flow Test: One Green Day Is Not a Trend

Thursday's session brought $221.7 million into US spot Bitcoin ETFs, the largest daily inflow in two months. It ended a ten-day streak that drained $2.73 billion from the complex and capped the worst ETF month on record, with June outflows north of $4 billion.

Look inside the number before celebrating. Fidelity's FBTC took in $166 million and ARKB added $92 million, but BlackRock's IBIT, the largest fund in the group, still bled $40 million on its eleventh straight red day. When the biggest holder base keeps de-risking while smaller funds turn green, that is reallocation, not fresh conviction.

Year-to-date net outflows still sit at $5.4 billion. Research this year estimates ETF flows now explain close to half of weekly Bitcoin price moves, so this ledger is not a sentiment indicator. It is a structural input. The test this week is simple: does Thursday get a second and third green day, and does IBIT stop bleeding.

The disclosure everyone skimmed. The flows everyone missed.

We read the boring documents so your Monday starts sharp. Free, every week.

Subscribe Free

Key Levels This Week

$63,800 Flip line. Clearing this breaks the lower high structure from the June decline. Next resistance sits at $66,600 to $67,600.
~$63,252 Current price. Roughly $550 below the flip line. The 20-day moving average near $62,500 needs to hold as support.
$56,200 Support. A break here opens the $50,000 to $53,000 zone.
$53,000 Realized price floor. Aggregate cost basis of all circulating supply. A sustained break puts the average holder underwater and removes the structural argument for the bull case.

The Calendar From Here

July 13, Senate returns. The CLARITY window reopens with the ethics clause now radioactive after the disclosure. Three working weeks to the August recess. Watch whether Republican leadership even schedules floor time.

July 14, June CPI. This is the number that sets the FOMC table. The weak jobs print already cooled rate-hike talk. A soft CPI reading reinforces that and gives Warsh room to soften language. A hot one swings hike odds back up and likely reverses last week's ETF momentum on the spot.

July 28 and 29, FOMC. The Fed decides into a market where positioning is stretched and every basis point of expectation is already traded. Whichever way CPI leans two weeks earlier, this meeting is where it gets priced for real.

This week itself is quieter. No Senate, no Fed, no major data until CPI. That leaves the daily ETF flow prints as the single most direct signal for whether last week's bounce has real sponsorship behind it. We covered the full on-chain backdrop, LTH accumulation, funding rates, and the $53,000 floor in detail in our indicators breakdown from last week.

Our Read Going Into the Week

We are in the setup phase, not the move. The base case is continued chop between $56,000 and $63,800 until the Senate returns and CPI lands.

The on-chain picture has not changed: long-term holders back in accumulation, exchange reserves at multi-year lows, leverage washed out. The fuel is there.

What has changed is the politics. A market structure bill blocked on an ethics clause just collided with the largest presidential crypto disclosure in history. The disclosure does not move price today. But it moves the odds on the biggest regulatory catalyst of the year, and those odds moved in the wrong direction over the weekend. If CLARITY slips past August recess, the market loses its most credible near-term fundamental catalyst and the macro headwinds carry more weight.

Watch the flows Monday through Wednesday. That is the short-term answer. The Senate and the CPI are the medium-term one. Everything else is waiting.


Sources

CNBC: Trump says outside funds run his money after disclosure shows billions in 2025 revenue
CNN: Trump made more than a billion dollars from cryptocurrency ventures in first year back in office
NBC News: Trump's financial disclosure lists $1.4 billion in crypto earnings, powered largely by meme coins
CoinDesk: Bitcoin ETFs see $221 million inflow, ending 10-day outflow streak
24/7 Wall St.: Bitcoin price prediction for July 2026

Disclosure: This article is for informational purposes only and is not financial advice. We may earn commissions from affiliate links. Always do your own research before making investment decisions.

Debt Hit $40 Trillion. The Bond Market Is What Mattered

US 30-year yield hit a 19-year high of 5.337% on August 18 before dropping on the buyback news. (TradingView) September 5, 2026 The ...

Debt Hit $40 Trillion. The Bond Market Is What Mattered