By BitBrainers Editorial
The data is not contradicting itself randomly. Each signal measures a different thing. Working through the disagreement produces a clearer picture than any single number alone.
What Fear and Greed Is Actually Measuring
Extreme Fear at 19 measures sentiment, not structure. It tells you how people feel, not what they own or what price they paid.
In 2022 and 2023, Extreme Fear readings corresponded to retail capitulation. Emotional sellers drove the price down, and the recovery came from the same retail base buying back in at lower levels.
This cycle is structurally different. A significant portion of the selling is coming from ETF redemptions. That is a mechanical process, not an emotional one. When an ETF investor redeems, the fund sells Bitcoin to meet that redemption regardless of how fearful or confident anyone feels.
The Fear and Greed signal assumes a seller who might change their mind. ETF redemptions do not reverse on sentiment alone. That is why the index is at 19 while the outflow streak ran for ten consecutive days before finally breaking this week.
Why MVRV Says the Bottom Is Not Confirmed
The MVRV Z-Score sits at 0.20 as of July 1. Bitcoin is trading near its aggregate realized value. That sounds neutral, and it roughly is.
The issue is that previous confirmed cycle bottoms did not stop at neutral. The Z-Score went negative in November 2022 and briefly negative again in early 2023. Negative MVRV means the average market participant is underwater. That is the level where forced sellers exhaust themselves.
At 0.20, that level has not been reached. The NUPL reading at 0.12 confirms the same picture from a different angle: the network holds minimal unrealized profit, but it has not flipped to aggregate loss.
Neither reading is screaming danger. Neither is screaming bottom.
The Number That Matters More Than $60K
The aggregate realized price, the average acquisition cost of all circulating Bitcoin supply, sits around $53,000. That is roughly 15% below current spot.
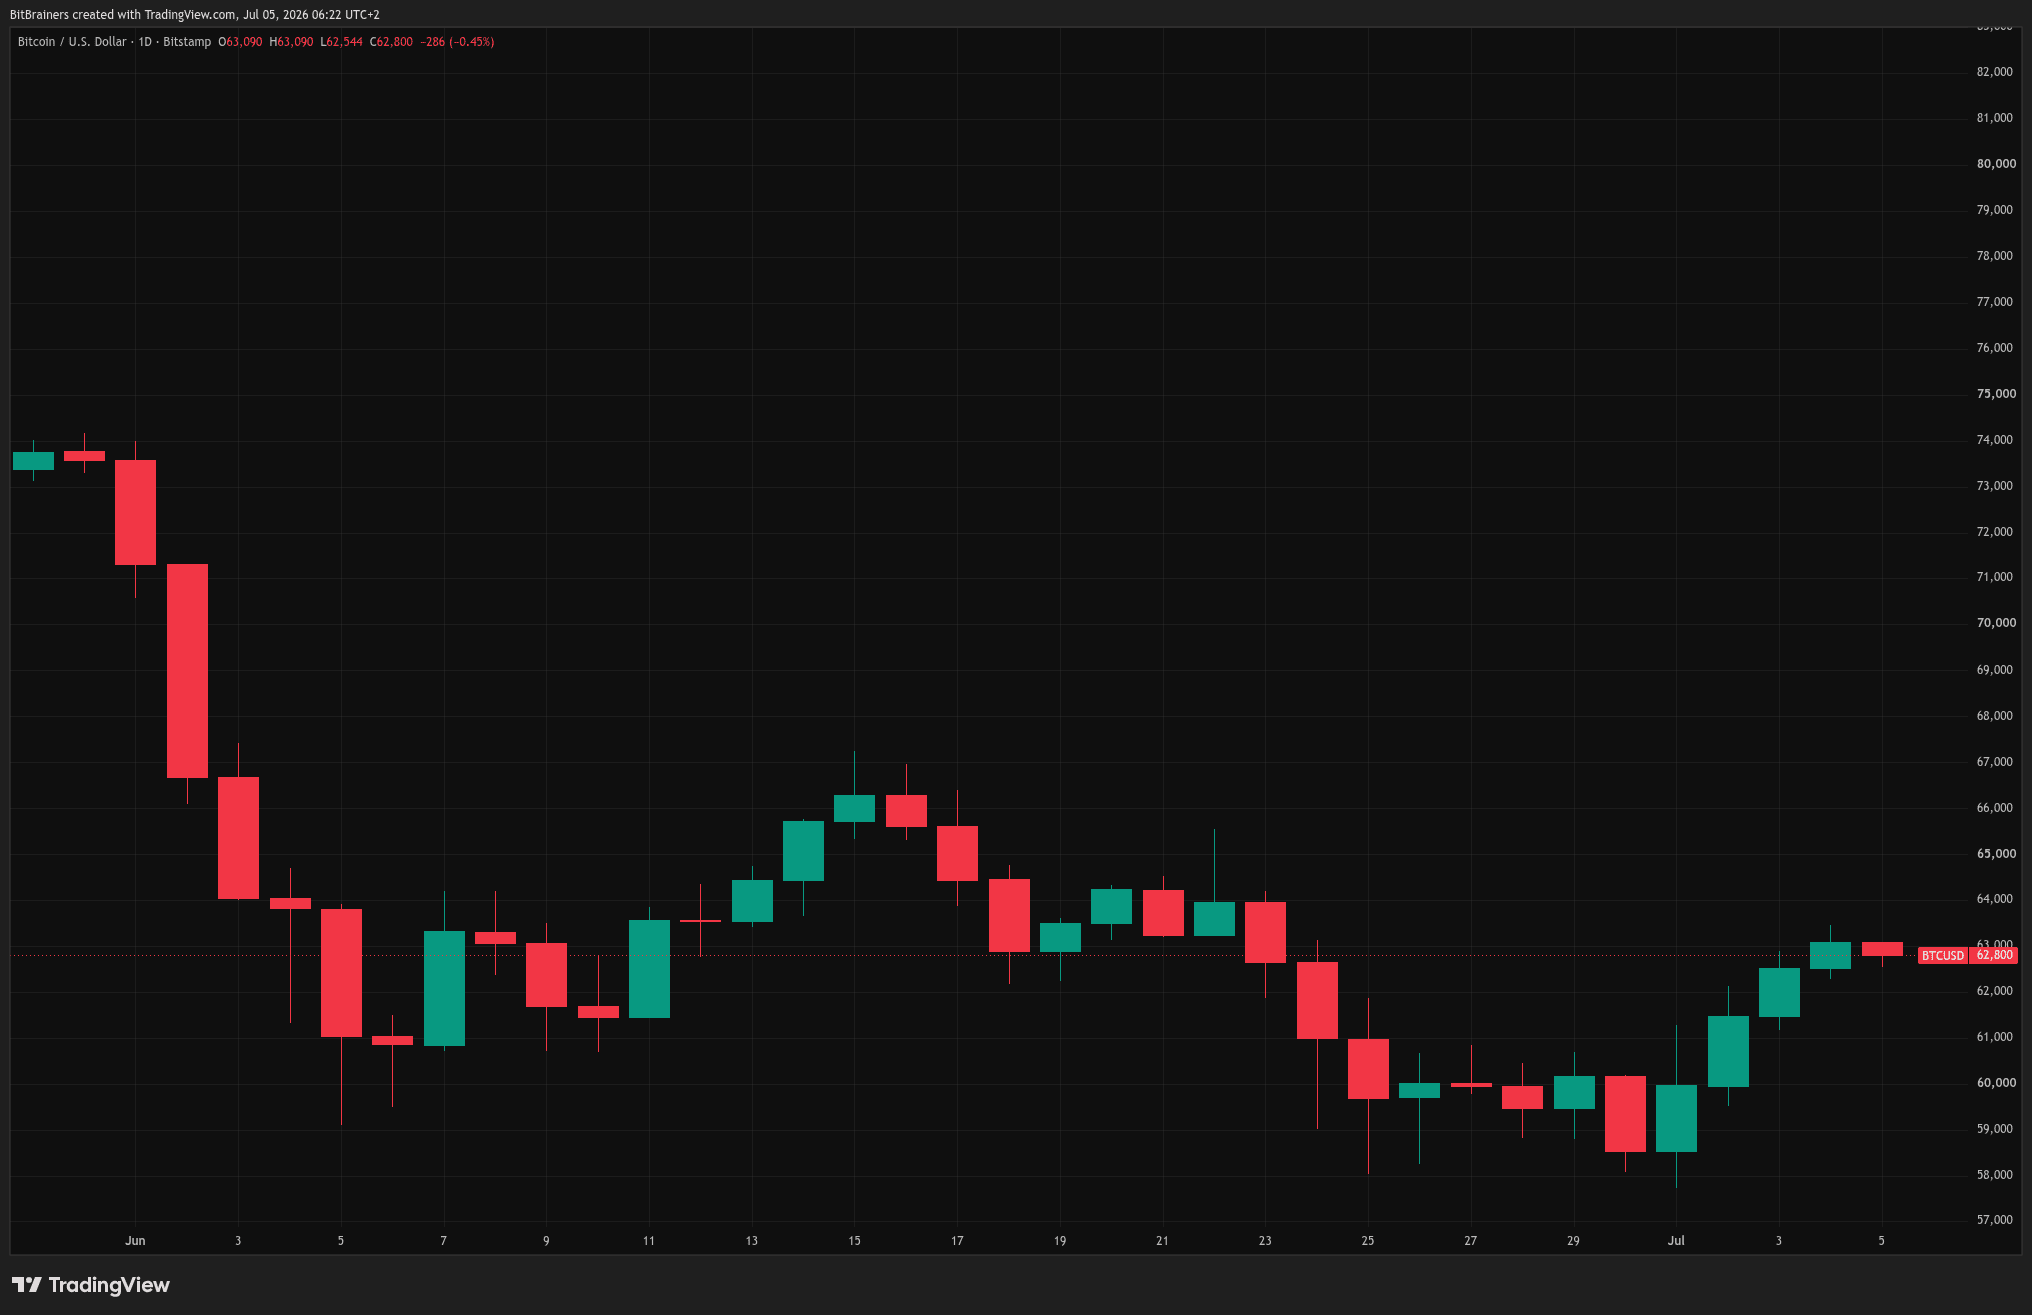
As long as Bitcoin trades above $53,000, the network in aggregate is in profit. Drop through that level and the entire post-2020 Bitcoin market goes underwater. That is the structural capitulation line. Not $58,000. Not $60,000. $53,000.
Bitfinex described the realized price hold as "the strongest structural argument the bull case has," adding it is "support only till the mechanical sellers allow it to be." Bitcoin is currently 15% above it. That is margin, not safety.
One clarification worth making: briefly dipping below $53,000 and recovering is not automatically a death sentence. Previous cycles have seen the realized price tested and then held as a launchpad. What would confirm a deeper problem is a sustained break with continued ETF outflows and no LTH response. A wick below followed by a bounce is a different story than a weekly close through it.
We covered the ETF mechanics in more detail in our breakdown of the jobs data bounce and the first ETF inflow of the week.
The signals are splitting. We track what they mean.
One macro read every Monday, the key levels, the data that matters. Zero filter.
Subscribe FreeWhat Long-Term Holders Are Actually Doing
Here is where the picture gets genuinely interesting. Long-term holders, defined as wallets holding Bitcoin for at least 155 days, flipped from net distribution back to net accumulation in late June, according to Glassnode's Week 26 on-chain report.
LTH supply hit a record 16.3 million BTC. Exchange reserves dropped to a seven-year low of 2.21 million BTC. Coins are leaving exchanges and moving into longer-term storage while the market panics.
The cohorts leading the buying are smaller and mid-sized wallets, 100 to 1,000 BTC, not the largest whale addresses. Glassnode described this as "accumulation beneath the surface," and was careful to note it is too early to call a full accumulation regime. Early accumulation signals have failed before when macro conditions deteriorated faster than on-chain data could capture. That caveat is real. But the directional shift is on-chain, not a survey or a sentiment reading, and that distinction matters.
The Short Squeeze Nobody Is Talking About
Funding rates on perpetual futures hit their most negative reading in three years this week. Negative funding means leveraged traders are paying a premium to maintain short positions. They are betting against Bitcoin at a record rate, and this has persisted for weeks without the price break they are positioned for.
LTH accumulation plus record short positioning is a classic setup for a squeeze. The question is what provides the catalyst. Two candidates sit directly ahead: the Senate returns July 13 to resume CLARITY Act negotiations, and the FOMC meets July 28 and 29. Either event, if it lands on the soft side, hits a market where the short book is extremely crowded.
That is not a price prediction. It is a description of the fuel and the potential ignition points.
What Decides This
On Thursday July 3, Bitcoin ETFs pulled in $221.7 million, their largest single-day inflow in two months, ending the ten-day outflow streak. Fidelity's FBTC led with nearly $166 million. Year-to-date net outflows still sit around $5.4 billion, so one day does not reverse the picture. But the streak ending is not nothing.
The indicators are not disagreeing about Bitcoin's long-term thesis. They are disagreeing about timing. Long-term holders are buying now. MVRV says the structural reset is not complete. The realized price at $53,000 gives the bull case a concrete floor to defend. The short book is loaded for a squeeze that needs a spark.
If ETF inflows stabilize and the Senate produces visible progress on CLARITY before the August recess, the setup changes fast. If Warsh delivers another hawkish surprise at the July 28 FOMC and outflows resume, $53,000 stops being a margin and starts being the number on everyone's screen.
The most honest synthesis across all four signals is this: the data looks more like a mid-cycle correction than a full bear market bottom. Bear market bottoms require MVRV to go deeply negative, widespread LTH distribution, and exchange reserves rising as holders give up. None of those are present. What is present is a sentiment washout, mechanical ETF selling, and conviction buyers stepping in quietly underneath.
Mid-cycle corrections end. They just rarely end on a schedule. Right now Bitcoin has the right ingredients for both outcomes. That is what four indicators in disagreement actually looks like.
Sources
CoinDesk: Bitcoin long-term holders have returned to accumulation, Glassnode says
CoinDesk: $221 million flow into Bitcoin ETFs ending a painful 10-day outflow streak
The Block: Accumulation beneath the surface: Bitcoin rebounds above $61,000
AhaSignals: Bitcoin MVRV Z-Score and NUPL readings, July 1, 2026
24/7 Wall St.: Bitcoin Price Prediction for July 2026
FXStreet: Bitcoin long-term holders resume accumulation as ETF outflows keep institutional sentiment subdued
Disclosure: This article is for informational purposes only and is not financial advice. We may earn commissions from affiliate links. Always do your own research before making investment decisions.