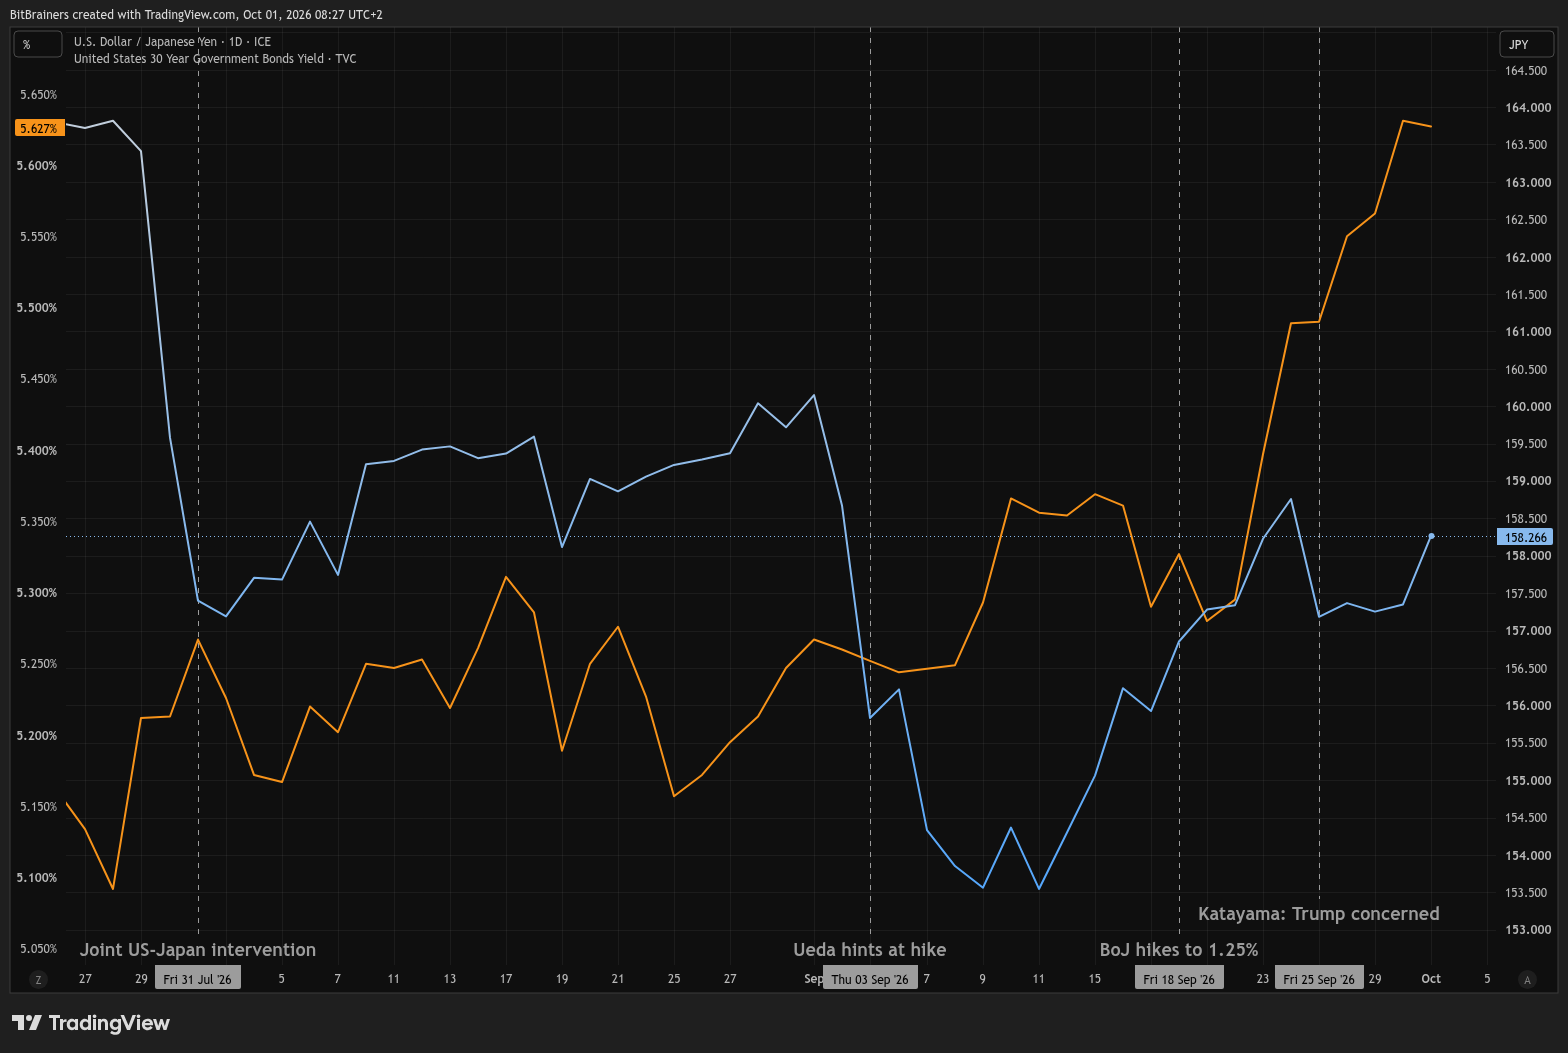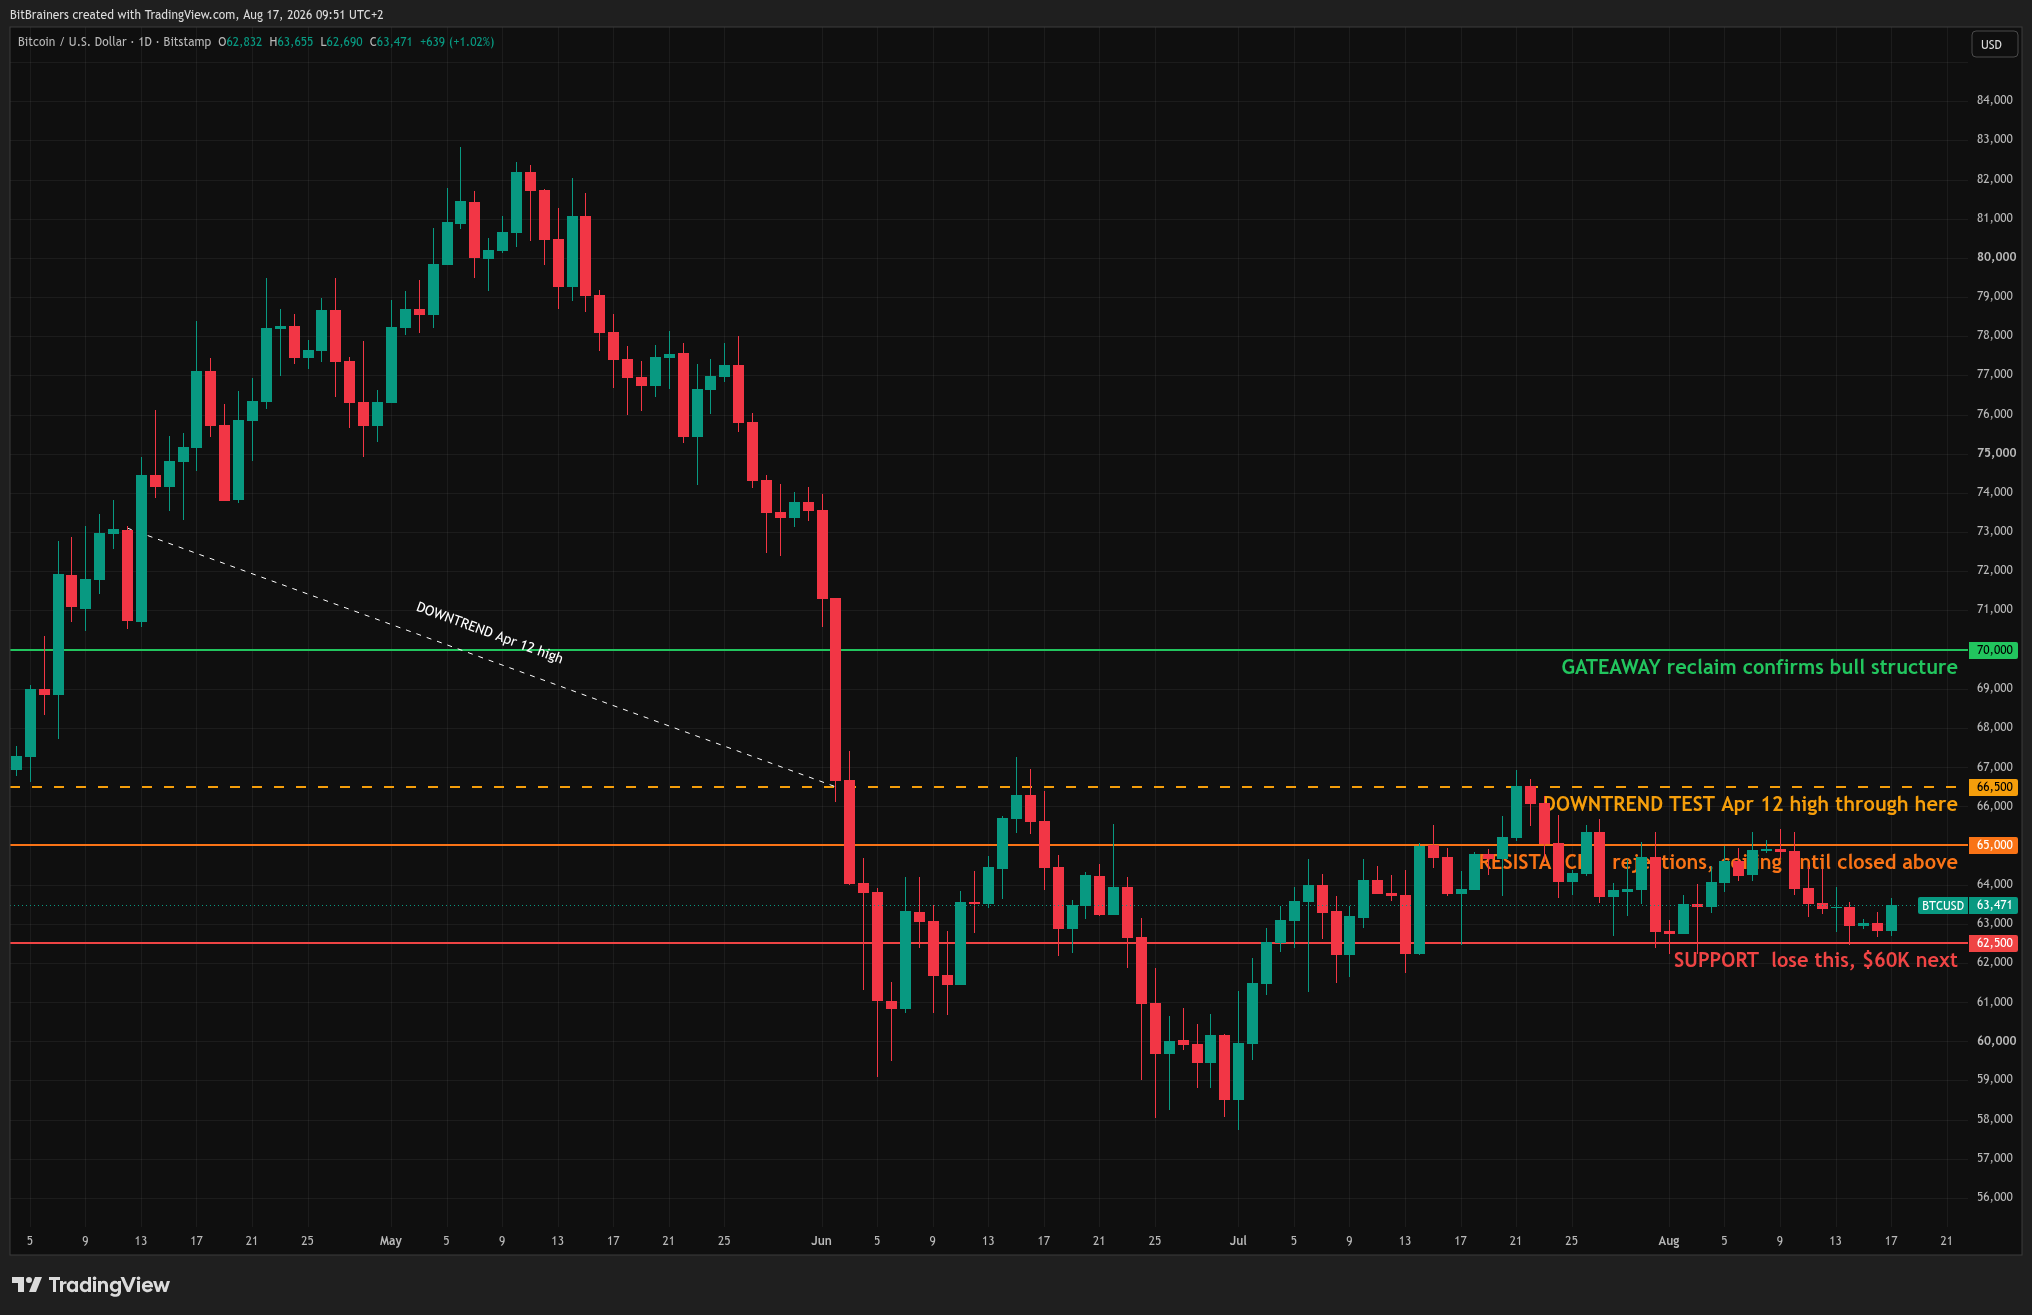
Bitcoin daily chart August 2026 showing compression between $62,500 support and $65,000 resistance.
By BitBrainers Editorial
Bitcoin has spent eleven days inside the same $62,600–$65,000 range and the market is waiting for Wednesday's FOMC minutes to provide a directional catalyst.
Support at $62,600 has been defended multiple times over the past two weeks. Resistance at $65,000 has produced three separate rejections. The structure is clean compression, not distribution.
The derivatives picture shows de-risking rather than bearish positioning. Open interest declined over the past week while price stayed flat. Funding rates are moderate. The market is not crowded long and not aggressively short. It is waiting for a macro trigger.
That trigger arrives Wednesday at 2:00 PM ET, when the Federal Reserve releases the minutes from its July 28–29 meeting. Three members dissented in favor of a rate hike. The language in those minutes around inflation, the neutral rate, or September guidance will move risk assets within minutes of release.
For holders, the priority is whether the $62,500 floor holds through the FOMC release and into the Jackson Hole symposium next week. If it does, the next test is $65,500. If it does not, the correction extends toward $60,000.
The full breakdown of this range, including the annotated TradingView chart with the four key levels, the Coinglass liquidation heatmap showing the $1.1 billion long exposure below $65K and the $750 million short cluster above $68K, the open interest and funding rate analysis, the Deribit Max Pain data for the September quarterly, the ETF flow breakdown with IBIT concentration data, and the complete macro calendar through Jackson Hole, is available in this week's BitBrainers Weekly Briefing.
Get the Weekly Briefing — $9/month, cancel anytime
Tools: Kraken for trading. Trezor for storage.
This is market commentary, not financial advice. Nothing here is a recommendation to buy or sell any asset. Do your own research.