Source: Checkonchain
By BitBrainers Editorial
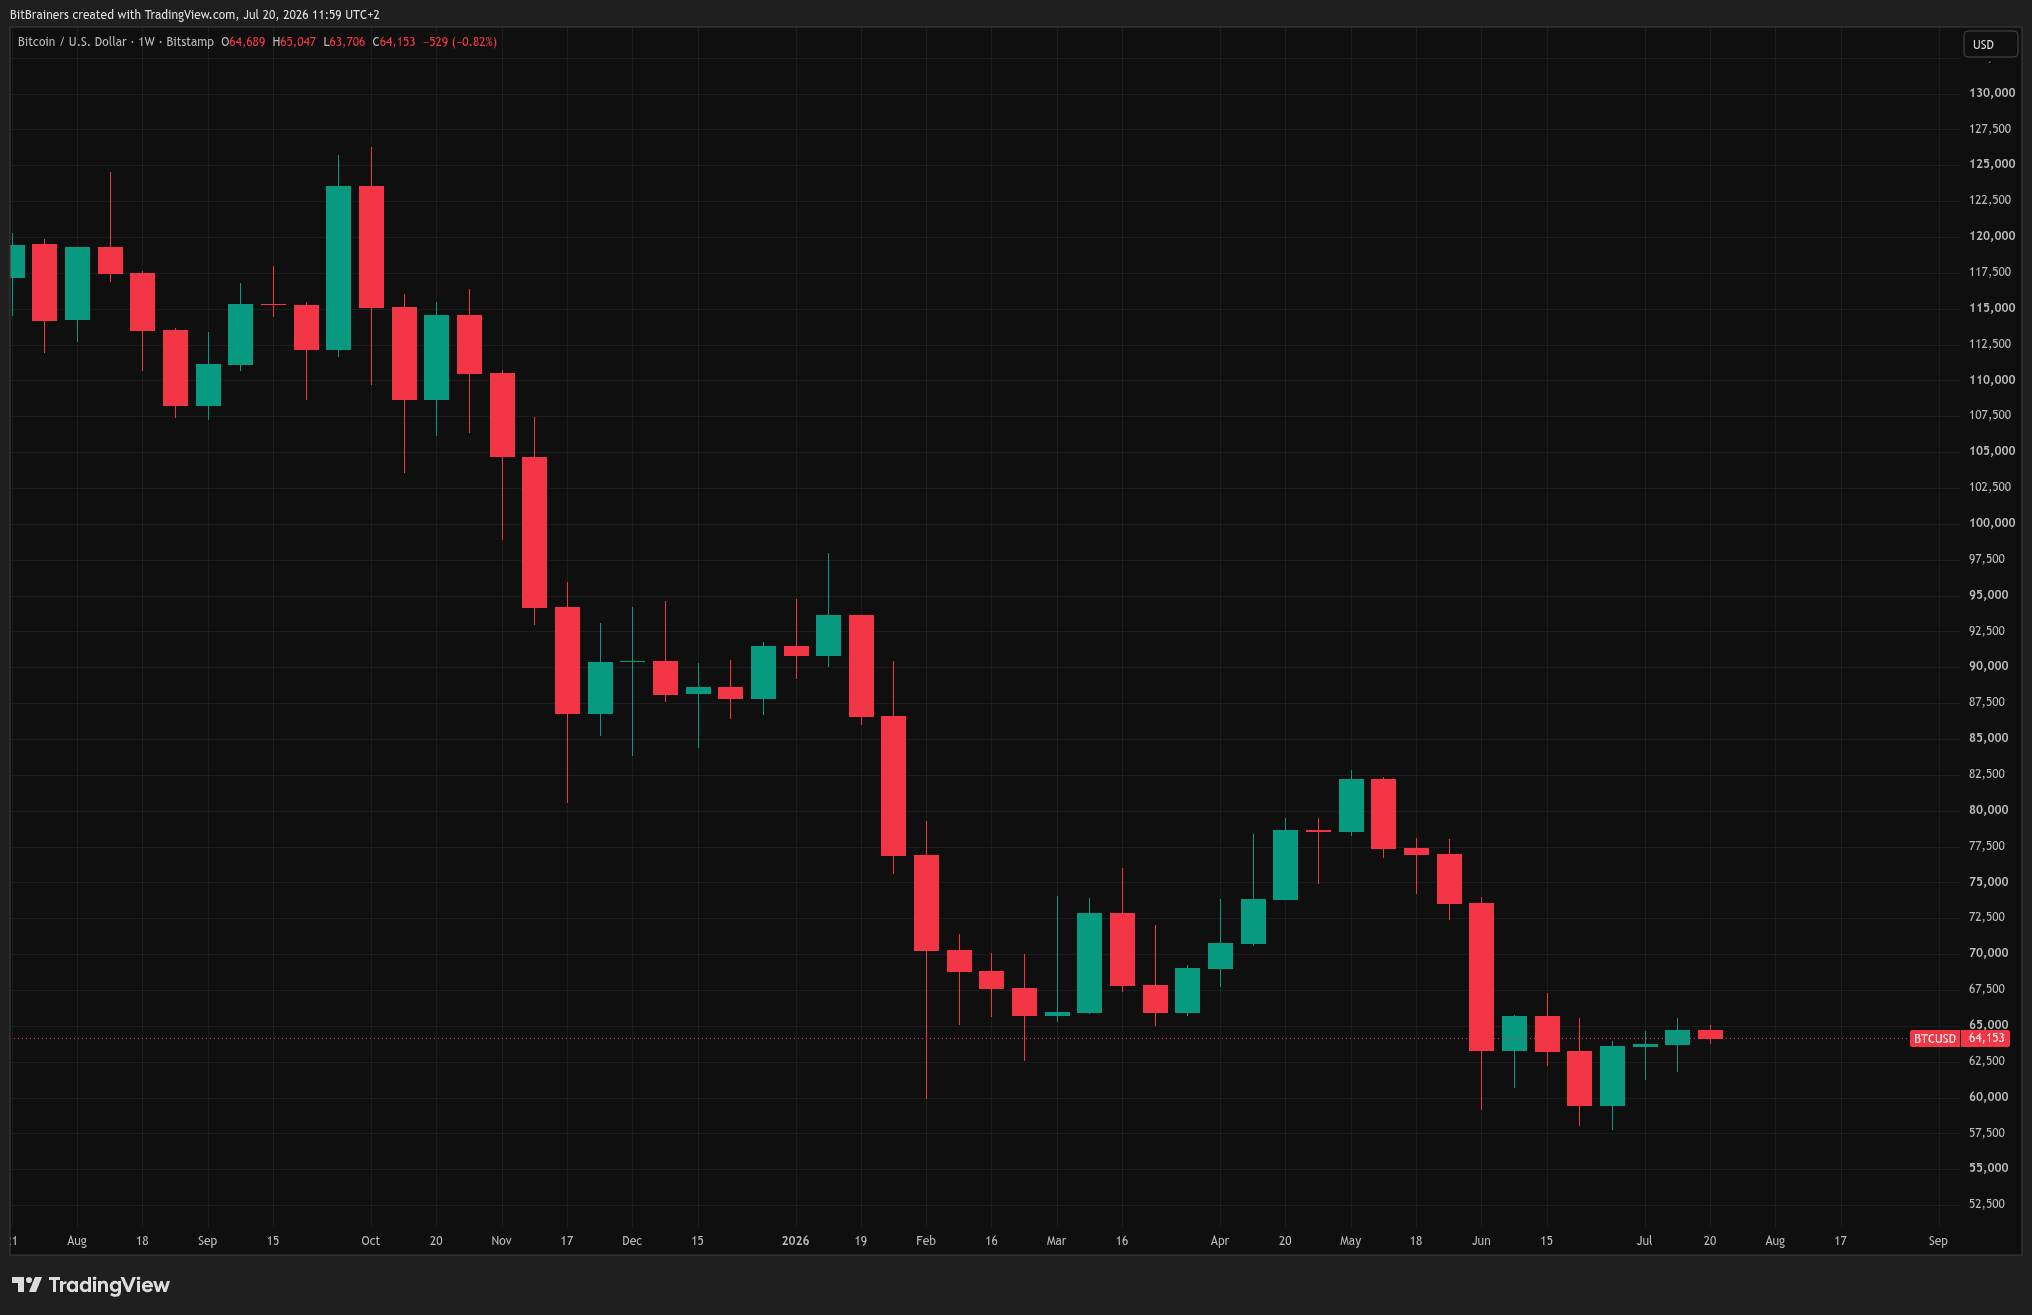
The weekly structure is bearish. Every bounce since November's all-time high near $126,000 has failed to reclaim the declining 21-week EMA. The current candle opened below it, tested it once on the CPI print last week, and is already pulling back. The 55-week EMA at $80,162 is the level Merlijn The Trader calls the "reclaim" line, the level that started the +1,644% run in 2020 and the +710% run in 2022. It is currently $16,000 above spot price.
The daily picture is tighter. The 21-day EMA is at $63,583, sitting just below current price as support. The 55-day EMA is at $65,313, capping price from above. Bitcoin is sandwiched between both. No fresh signal from the EMA cross on the daily since the short triggered on June 3 near $71,800 and exited June 6. Since then, nothing. The bot is flat and waiting.
The On-Chain Picture
Long-term holder Binary CDD has dropped to 0. That means LTHs are not spending. They accumulated through the entire drawdown from $126,000 to $57,800 and have not distributed into the bounce. The SOPR ratio for LTHs and short-term holders combined sits at 0.89, edging slowly upward. The two previous times SOPR hit this level, April 2020 and September 2023, both resolved with significant rallies.
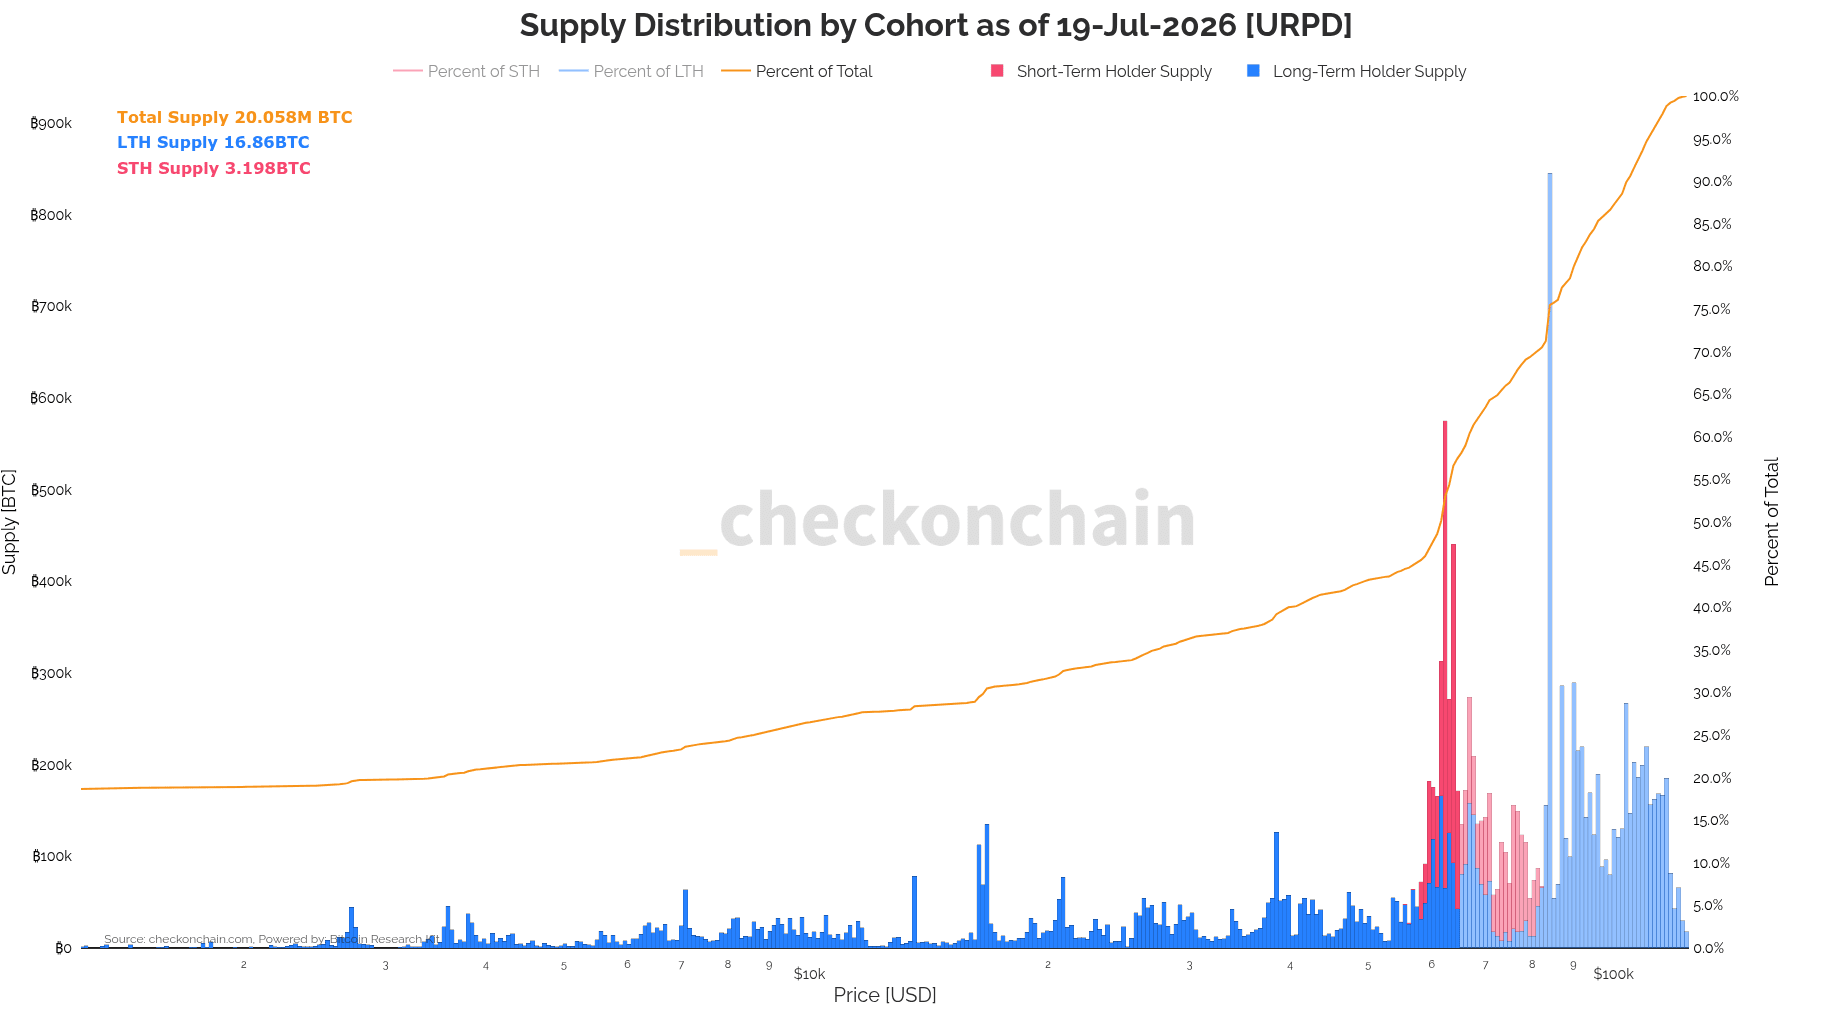
The $59,000 level is where slightly more than half of all traders hold their cost basis according to Checkonchain. The July 1 low of $57,800 tested just below it and bounced. That level held. It is now the floor that defines whether the structure is constructive or still distributing.
None of this confirms a bottom. The on-chain picture says the floor is under construction, not finished.
Weekly levels. Real data. No hopium.
Get the breakdown every Monday before the market opens.
SubscribeThe ETF Picture
Spot Bitcoin ETFs recorded two consecutive weeks of net inflows after an eight-week, $8 billion outflow streak. Last week brought $75.7 million, the week before $197.4 million. The bleeding has stopped. Year-to-date net outflows still sit at $5.4 billion and the two-week recovery represents roughly 3% of what left in 2026.
The key caveat: last Monday saw $424.7 million drain out in a single session following renewed US-Iran military conflict. The net positive week only held because the rest of the week offset that single day. IBIT, BlackRock's fund, is still seeing inconsistent flows. A multi-week positive trend from IBIT specifically is the signal that institutional re-entry is structural rather than tactical.
ETF flows now explain roughly 45% of weekly Bitcoin price moves. The inflows are a tailwind. They are not yet a catalyst.
The Macro Overlay
The Fed enters its pre-FOMC blackout period today. No speeches, no interviews, no guidance until Chair Warsh speaks on July 29. The meeting itself is July 28-29. Markets price roughly 70% odds of a hold.
Brent crude is at $91, its highest level since June, driven by US-Iran strikes in the Strait of Hormuz and US crude inventories at a 42-year low of 726 million barrels, equivalent to 42 days of refinery demand. The June CPI relief that pushed Bitcoin to $65,471 last week was built on cheaper gasoline during a brief ceasefire window. That window closed. The July CPI will look different.
The CLARITY Act is also running down its last realistic window before the Senate leaves for recess. Regulatory clarity has been a positive sentiment driver. Its absence would remove one of the tailwinds the bounce has been leaning on. We covered the CLARITY hearing earlier this month here.
Levels to Watch
Resistance: $65,313 (55-day EMA), $65,631 (50-month EMA), $68,000 (200-week EMA). The 200-week EMA is the level that started every previous bull run. Price has not tested it since the decline began.
Support: $63,583 (21-day EMA), $59,000 (majority cost basis), $57,800 (July 1 low and structural floor).
The range is tight. A weekly close above $65,631 opens the path toward $68,000 and the Merlijn reclaim thesis. A weekly close below $63,583 puts $59,000 back in focus before FOMC.
What to Watch This Week
FOMC blackout runs through July 29. No macro guidance until then. Watch Brent crude for inflation expectations and ETF daily flows for institutional direction. The CLARITY Act Senate timeline resolves this week. Any fresh Hormuz escalation hits both oil and Bitcoin sentiment simultaneously. The setup is tight and the catalysts are live.
Sources
Bloomberg Bitcoin ETFs Attract Inflows for Second Week After Two-Month Outflows
CoinDesk BTC ETFs attract $273 million in two weeks. That's peanuts compared to recent exodus
KuCoin Bitcoin's $59K Level Could Be Key to Next Move as Long-Term Holders Stay
Crypto Times Crypto Week Ahead: CLARITY Act Deadline, Big Tech Earnings, the Pre-FOMC Calm
This is market commentary, not financial advice. Nothing here is a recommendation to buy or sell any asset. Do your own research.
BitBrainers Editorial