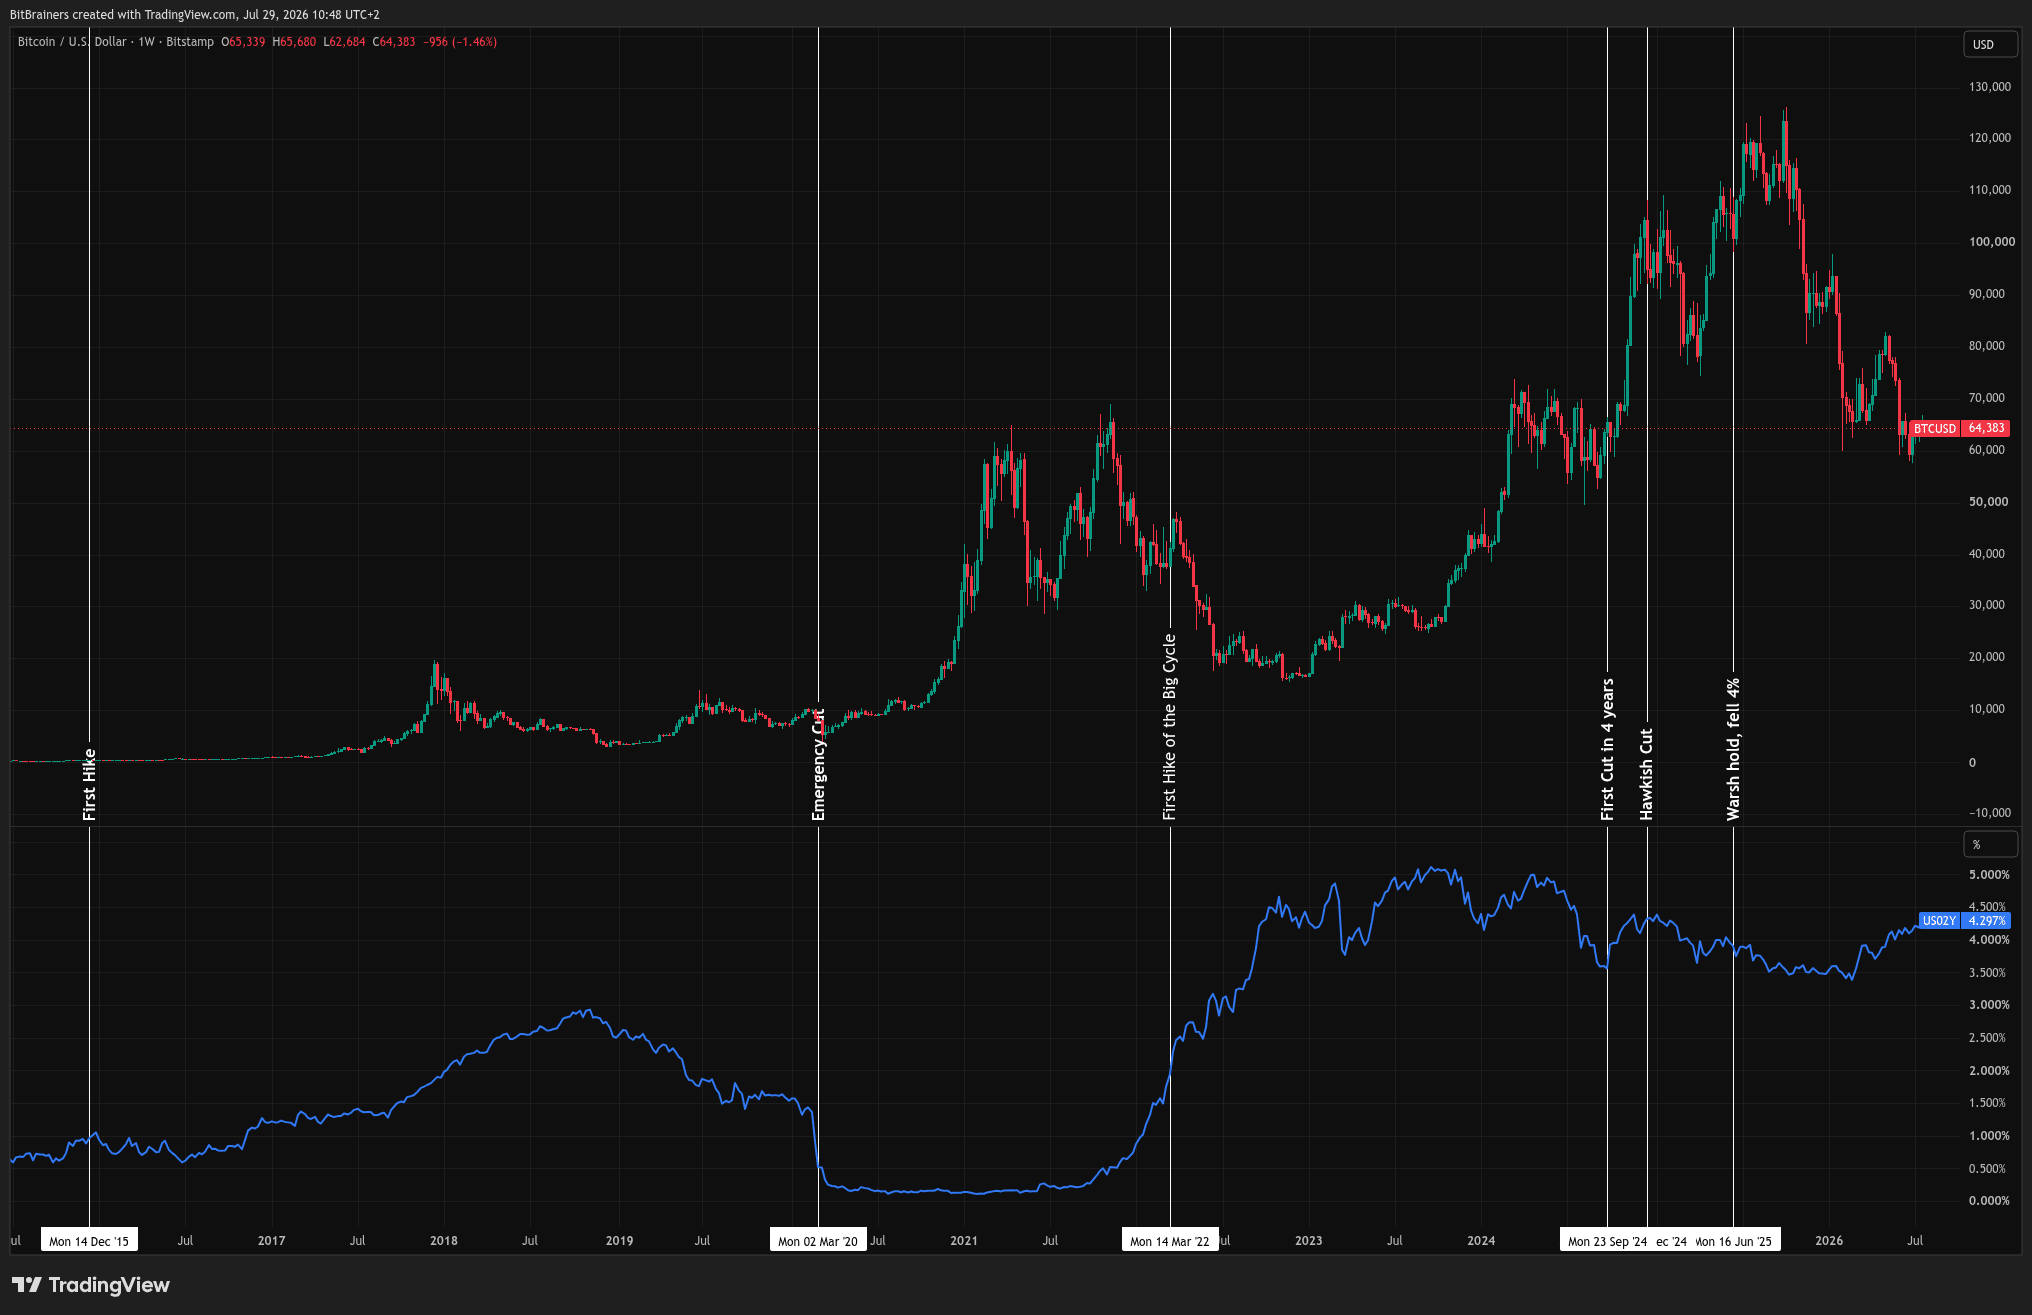
BTCUSD weekly, log scale, with US 2-Year Treasury Yield (lower pane) and FOMC decision dates marked. Source: TradingView / Bitstamp.
By BitBrainers Editorial
Before that lands, it is worth going through what the Fed has actually done to Bitcoin over eleven years of policy decisions. The record is messier than either side of the argument admits.
The short version: the level of the federal funds rate is almost irrelevant. What moves Bitcoin is the gap between what was priced before the meeting and what the Fed communicated on the day. That gap is the variable. The rate itself is just the number everyone argues about.
The Full Record at a Glance
Each row below uses a consistent 24-hour close-to-close window after the decision. Confounders are flagged where they own a meaningful share of the move.
| Date | Fed Action | What Was Priced | BTC 24h Move | Main Confounder |
|---|---|---|---|---|
| Dec 16, 2015 | +25 bp (first hike since 2006) | Fully priced | Flat / slight + | None significant |
| Jul 31, 2019 | -25 bp (first cut in a decade) | Fully priced; rally had run since April | -5% then continued lower | Easing cycle absorbed in advance |
| Mar 3, 2020 | -50 bp emergency | Not priced; between meetings | -4% same day; -55% over 9 days | Pandemic liquidity crisis; global cash dash |
| Mar 16, 2022 | +25 bp (first hike of the cycle) | Fully priced | +~$3,000 on the day | Relief rally after weeks of pre-pricing |
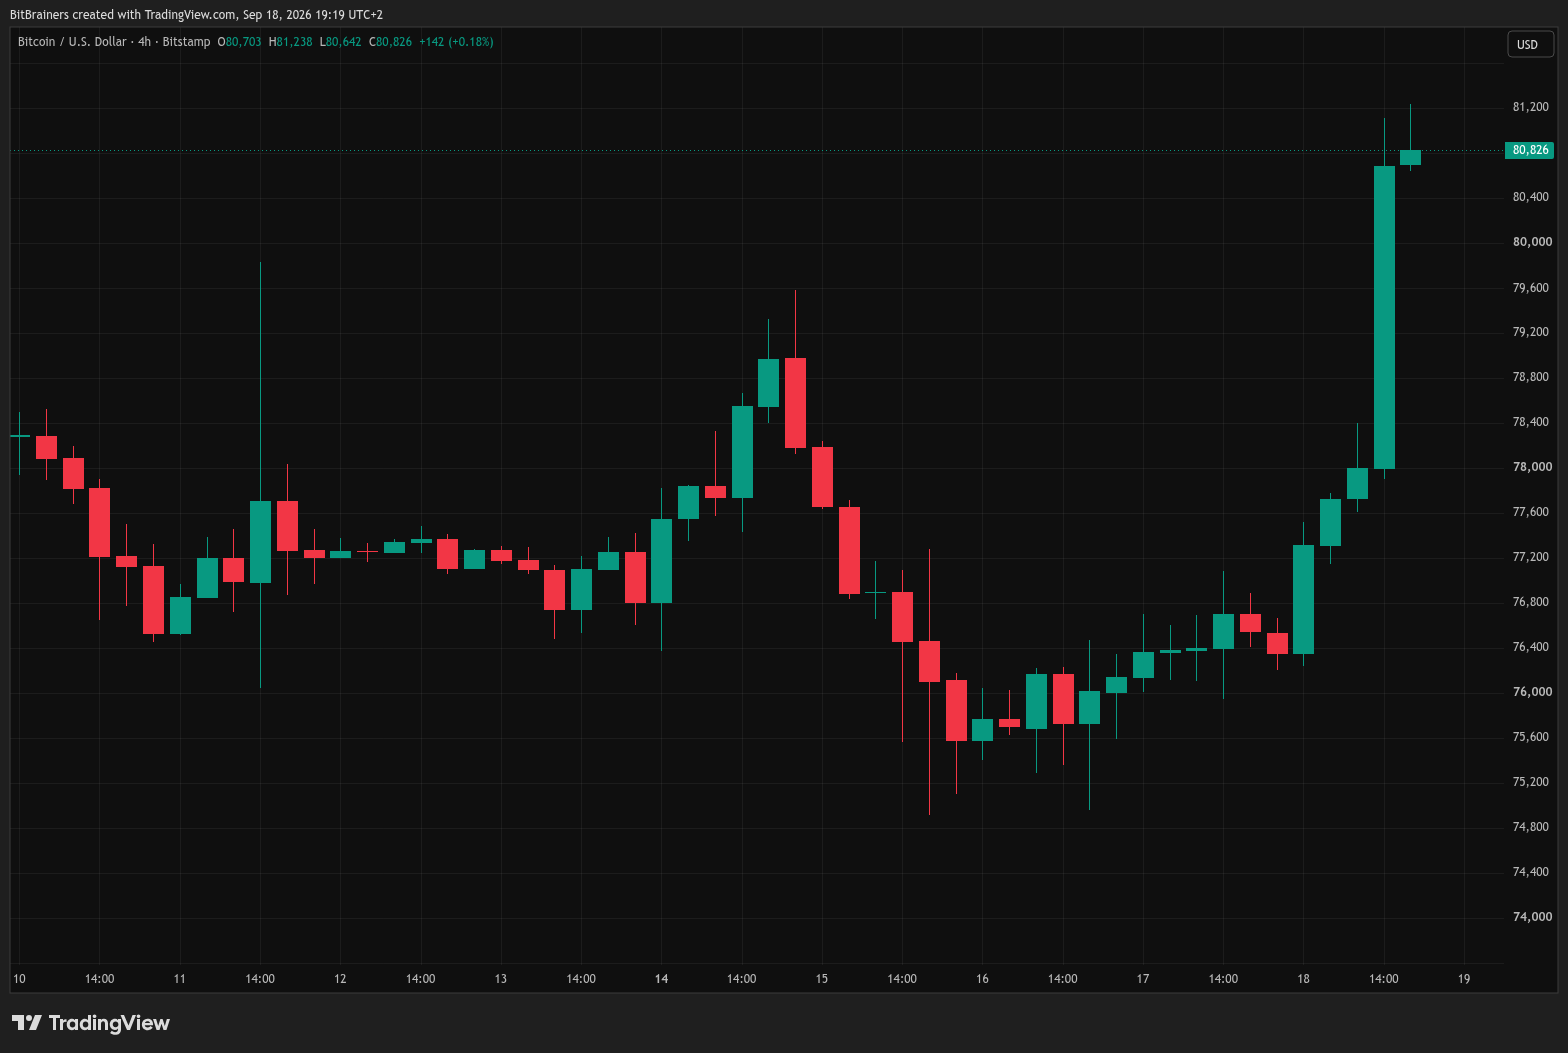
| Sep 18, 2024 | -50 bp (first cut in four years) | Partially priced; genuine policy shift | +6.6% over one week | Clean signal; strongest post-cut reaction in data |
| Dec 18, 2024 | -25 bp + 2025 dot plot cut from 4 to 2 | Cut priced; dot shift was the surprise | -5.7% from $108K record | Path hawkish despite rate dovish |
| Oct 29, 2025 | -25 bp + Powell signals December not certain | Cut priced; guidance was the surprise | -6% ($116K to $109K within hours) | Verbal guidance outweighed the cut |
| Dec 10, 2025 | -25 bp; 3 dissents (most since 2019) | Cut priced; dissent count was the signal | -2.1% to $90K after brief pop | Market read dissents as easing cycle ending |
| Jun 17, 2026 | Hold at 3.50-3.75%; dot plot hawkish; 9/18 project hike | Hold priced at 99%; dot shift was surprise | -4% to $64K; 2Y yield +14 bp | Rate unchanged; expected path moved materially |
The First Entry Is a Hike, and It Was Bullish
The Fed lifted rates off zero on December 16, 2015, its first hike since 2006. Bitcoin ended that year around $430 and did nothing dramatic in response.
The Fed hiked again in December 2016, then three more times during 2017. Over that same stretch Bitcoin went from under $1,000 to $19,783 on December 17, 2017.
Then 2018 arrived. The Fed hiked four more times, and Bitcoin fell roughly 70 percent, from about $13,400 in January to near $3,800 by year end.
Same policy direction, two opposite outcomes, two consecutive years. Anyone claiming rate hikes are mechanically bearish for Bitcoin has to explain 2017, and anyone claiming they are irrelevant has to explain 2018.
2019: The Rally Front-Ran the Cut and Then Died
The Fed cut on July 31, 2019, its first cut in more than a decade, and followed with two more in September and October. This should have been the cleanest bullish setup in the dataset.
It was not. Bitcoin had already run from under $4,000 at the start of 2019 to nearly $14,000 by late June, a full month before the first cut arrived.
By December, with all three cuts delivered, price was back near $7,000. The easing cycle was fully absorbed on the way in and gave nothing back on the way out.
March 2020: The Cut Was the Warning, Not the Relief
On March 3, 2020, the Fed made an emergency 50 basis point cut between scheduled meetings. Bitcoin fell, from roughly $8,800 to $8,400.
Nine days later came the crash that everyone still remembers: price cut in half inside 24 hours, from around $8,000 to $3,800. On March 15 the Fed cut again, to zero, and restarted asset purchases.
The lesson from that week is the one most people skip. An emergency cut is information about how bad the situation is, and markets priced the information before they priced the liquidity.
The liquidity did arrive, and it mattered enormously. Bitcoin finished 2020 near $29,000, then kept going. It just took months, not minutes.
Eleven Hikes, and the First One Was Green
March 16, 2022 was the start of the fastest tightening cycle in four decades. On the day itself, Bitcoin held above $40,000 and added roughly $3,000 within a day.
The cycle-level damage was severe anyway. Bitcoin opened 2022 near $47,000 and bottomed around $15,500 in November, though the FTX collapse landed in that same month and owns a share of the bottom.
Fed day is a recurring market event. Be ready for the next one.
Weekly macro and Bitcoin analysis, every Monday before the market opens.
SubscribeThe meeting-day reactions inside that cycle were not uniform. Bitcoin rose from about $16,500 at the start of 2023 to roughly $28,000 by the end of March, straight through hikes in February and March.
The final hike of the cycle came on July 26, 2023, taking the range to 5.25 to 5.50 percent. Bitcoin sat near $29,000 and barely reacted, because there was nothing left to learn from it.
2024 Produced the One Clean Signal in the Data
On September 18, 2024, the Fed cut 50 basis points, its first cut in four years. Bitcoin gained roughly 6.6 percent over the following week and held about 11 percent a month later.
The November 7, 2024 cut looked even stronger in the data, with gains near 16 percent in a week. That number is not clean, because the US election had resolved two days earlier and was doing most of the work.
Then December 18, 2024. The Fed cut as expected, and the 2025 median dot dropped from four projected cuts to two. Bitcoin fell from a record $108,364 to a low near $100,300, down 5.7 percent in 24 hours. The rate went down. Price went down with it.
2025: Three Cuts, No Payment
The Fed cut in September, October, and December of 2025, ending at 3.50 to 3.75 percent. Bitcoin's all-time high of $126,198 was set on October 6, before two of those three cuts had even happened.
The October 29 cut is the sharpest example. Powell delivered the cut, then said December was not guaranteed, and Bitcoin dropped from about $116,000 to $109,000 within hours. The verbal guidance outweighed the rate move entirely.
The December 10 cut got a brief pop above $92,000 before settling back near $90,000, down 2.1 percent on the day. Three dissents, the most since 2019, told the market the easing had run out of committee support.
June 17, 2026: Nothing Moved and Price Fell Anyway
Kevin Warsh's first meeting produced a unanimous 12 to 0 hold at 3.50 to 3.75 percent. Rates were untouched. Bitcoin fell about 4 percent to $64,000.
What moved was the expected path. Nine of eighteen participants penciled in at least one hike by year end, the PCE forecast went to 3.6 percent from 2.7 percent in March, and Warsh declined to submit a dot of his own while stripping forward guidance from the statement entirely.
Two-year Treasury yields jumped over 14 basis points on the day. That is the number Bitcoin was actually trading against, not the target range.
Why the Overnight Rate Is Almost Irrelevant
The federal funds rate is an overnight interbank lending rate. It directly controls the cost of borrowing money today. What it does not directly control is the expected cost of money over the next one to three years, which is the horizon that matters for risk assets.
Bitcoin trades on forward liquidity. When investors expect money to get cheaper over time, the discount rate applied to future cash flows falls, risk appetite rises, and capital moves toward high-beta assets. When the expected path tightens, the opposite happens. The two-year Treasury yield is a much cleaner proxy for that expectation than the fed funds rate itself, which is why the June 2026 hold still produced a 14 basis point move in 2s and a 4 percent drop in Bitcoin.
The post-ETF era has amplified this further. Institutional flows now track policy expectations in near real time. Bitcoin front-runs the expected path rather than waiting for the rate to move, which is the same mechanism that explains why 2019 and 2025 saw the rally arrive before the cuts and evaporate afterward. That dynamic is also related to the M2 lag we covered in Bitcoin follows M2 with a lag nobody agrees on.
What the Record Actually Shows
Across eleven years, the level of the federal funds rate explains close to nothing on its own. Bitcoin had its biggest percentage bull run during a hiking cycle and its worst drawdown of the last two years during a cutting cycle.
What shows up repeatedly is the gap between what was priced going in and what the Fed communicated coming out. December 2024, October 2025, and June 2026 were all moves in the expected path, with no surprise in the rate itself, and Bitcoin fell after each one. September 2024 was a genuine policy shift that the market had not fully absorbed, and it was the one clean positive reaction.
One thing to be careful with. You will see stats in your feed claiming Bitcoin fell after eight of the last nine FOMC meetings, or six of seven, or that it rallied after only one of eight in 2025. Those are three different counts of an overlapping period. They disagree because each picks a different measurement window. A statistic that flips depending on whether you measure at 2 hours, 48 hours, or a week is a framing choice, not an edge.
The honest version is narrower. Bitcoin reacts hard when the Fed changes the expected path, in either direction, and reacts weakly when the Fed does what was already priced. Everything else in the record is other news wearing a Fed costume.
What Today Can Change
There is no Summary of Economic Projections at this meeting, so there is no dot plot to reprice against. That removes the exact mechanism that did the damage in June.
What is left is the statement wording and Warsh's press conference at 2:30 PM Eastern. He has already shown he will use a shorter statement and refuse to hand markets a guidance anchor. June demonstrated what happens when he does.
A hold with unchanged language is the outcome the record says produces the least movement. A hold delivered with hike language, or an actual hike against a market pricing one at roughly a third probability, is the scenario where the June template repeats.
Bitcoin is near $63,000 with the February low of $60,074 and the May low of $59,130 sitting underneath. Those are the levels that matter if the tone lands hawkish, and there is nothing in the eleven-year record suggesting a dovish surprise is the base case right now.
Sources
Federal Reserve: FOMC Minutes, June 16-17, 2026
Decrypt: Morning Minute: Crypto Sinks After Hawkish FOMC
CryptoSlate: Bitcoin falls to $100,000 following hawkish FOMC despite 25bp rate cut
IG: Fed's hawkish stance rattles Bitcoin amid surging US dollar
CNBC: Fed cuts rates by a quarter point, signals caution ahead
Investing.com: Bitcoin Stalls Near $90K as Rate Cut Volatility Triggers a Broad Deleveraging Wave
Capital.com: Bitcoin price history 2009-2026, key milestones
FXStreet: Bitcoin price maintains uptrend in response to the Federal Reserve's rate hike
This is market commentary, not financial advice. Nothing here is a recommendation to buy or sell any asset. Do your own research.