By BitBrainers Editorial
The problem starts with the lag itself. Nobody actually agrees on what it is.
What M2 Is, Briefly
M2 is a standard measure of money circulating in an economy: cash, checking accounts, savings, money market funds, and small time deposits. It's the number central banks and traders watch as a proxy for how much liquidity is sloshing through the system.
When M2 expands, the theory goes, more money is chasing the same amount of goods and assets. Scarce assets like Bitcoin should benefit as that liquidity looks for somewhere to go. The mechanism is intuitive. The timing is where it falls apart.
The Lag Keeps Changing, Which Should Bother You
Some analysts run a 70-day lag between M2 and Bitcoin's price reaction. Others use 12 weeks, or a flat 90 days. More recent research has produced 56-to-60-day windows, and separately a 102-day window from a different sample period.
If the same relationship keeps producing different answers depending on who ran the numbers and when, the lag isn't a law. It's a curve fit dressed up as a rule.
What the Correlation Actually Shows
One analysis running daily price data over a full year found Bitcoin's correlation to M2 shifted back 84 days sits around 0.78, with 0.77 for the forward-shifted version. That's a real relationship, not noise.
But the same dataset found Bitcoin's correlation to the dollar index running at negative 0.58, and the dollar index correlates with M2 at negative 0.71. Three variables leaning on each other makes it genuinely hard to isolate M2 as the driver instead of dollar weakness doing the driving, with M2 just riding along for the same macro reasons.
The same research found the dollar index moves faster and more directly against Bitcoin's price than M2 growth does. M2 tends to align with Bitcoin at slower turning points, while the dollar reacts closer to real time. The two get treated as interchangeable on social media. They aren't.
Macro moves the chart before the news does.
Get the read before it's priced in. No hopium, wins and losses in public.
Subscribe FreeThe Rigorous Version of the Claim
A peer-reviewed study by economist Pejvak Kokabian ran a cointegration analysis and found a long-run elasticity of 2.65. That means a 1% increase in M2 associates with a 2.65% increase in Bitcoin's price over the long run, based on monthly data from January 2015 to April 2025.
The same study found an error-correction term of negative 0.12, meaning roughly 12% of any gap between Bitcoin's actual price and where the M2 relationship says it should be gets closed every month.
Worth being precise here: that study tests US M2, the Fed's M2SL series, against Bitcoin's price. It isn't the aggregated "global M2" figure most of the viral overlay charts use. The two series move together most of the time, but they aren't the same number, and swapping one for the other without saying so is how a specific finding gets stretched into a broader claim than it actually supports.
That's still a more careful version of the chart everyone reposts. It also carries a built-in admission: a 12%-per-month correction means the catch-up takes real time, and it holds on average, not on anyone's fixed calendar.
The Relationship Just Broke, in Real Time
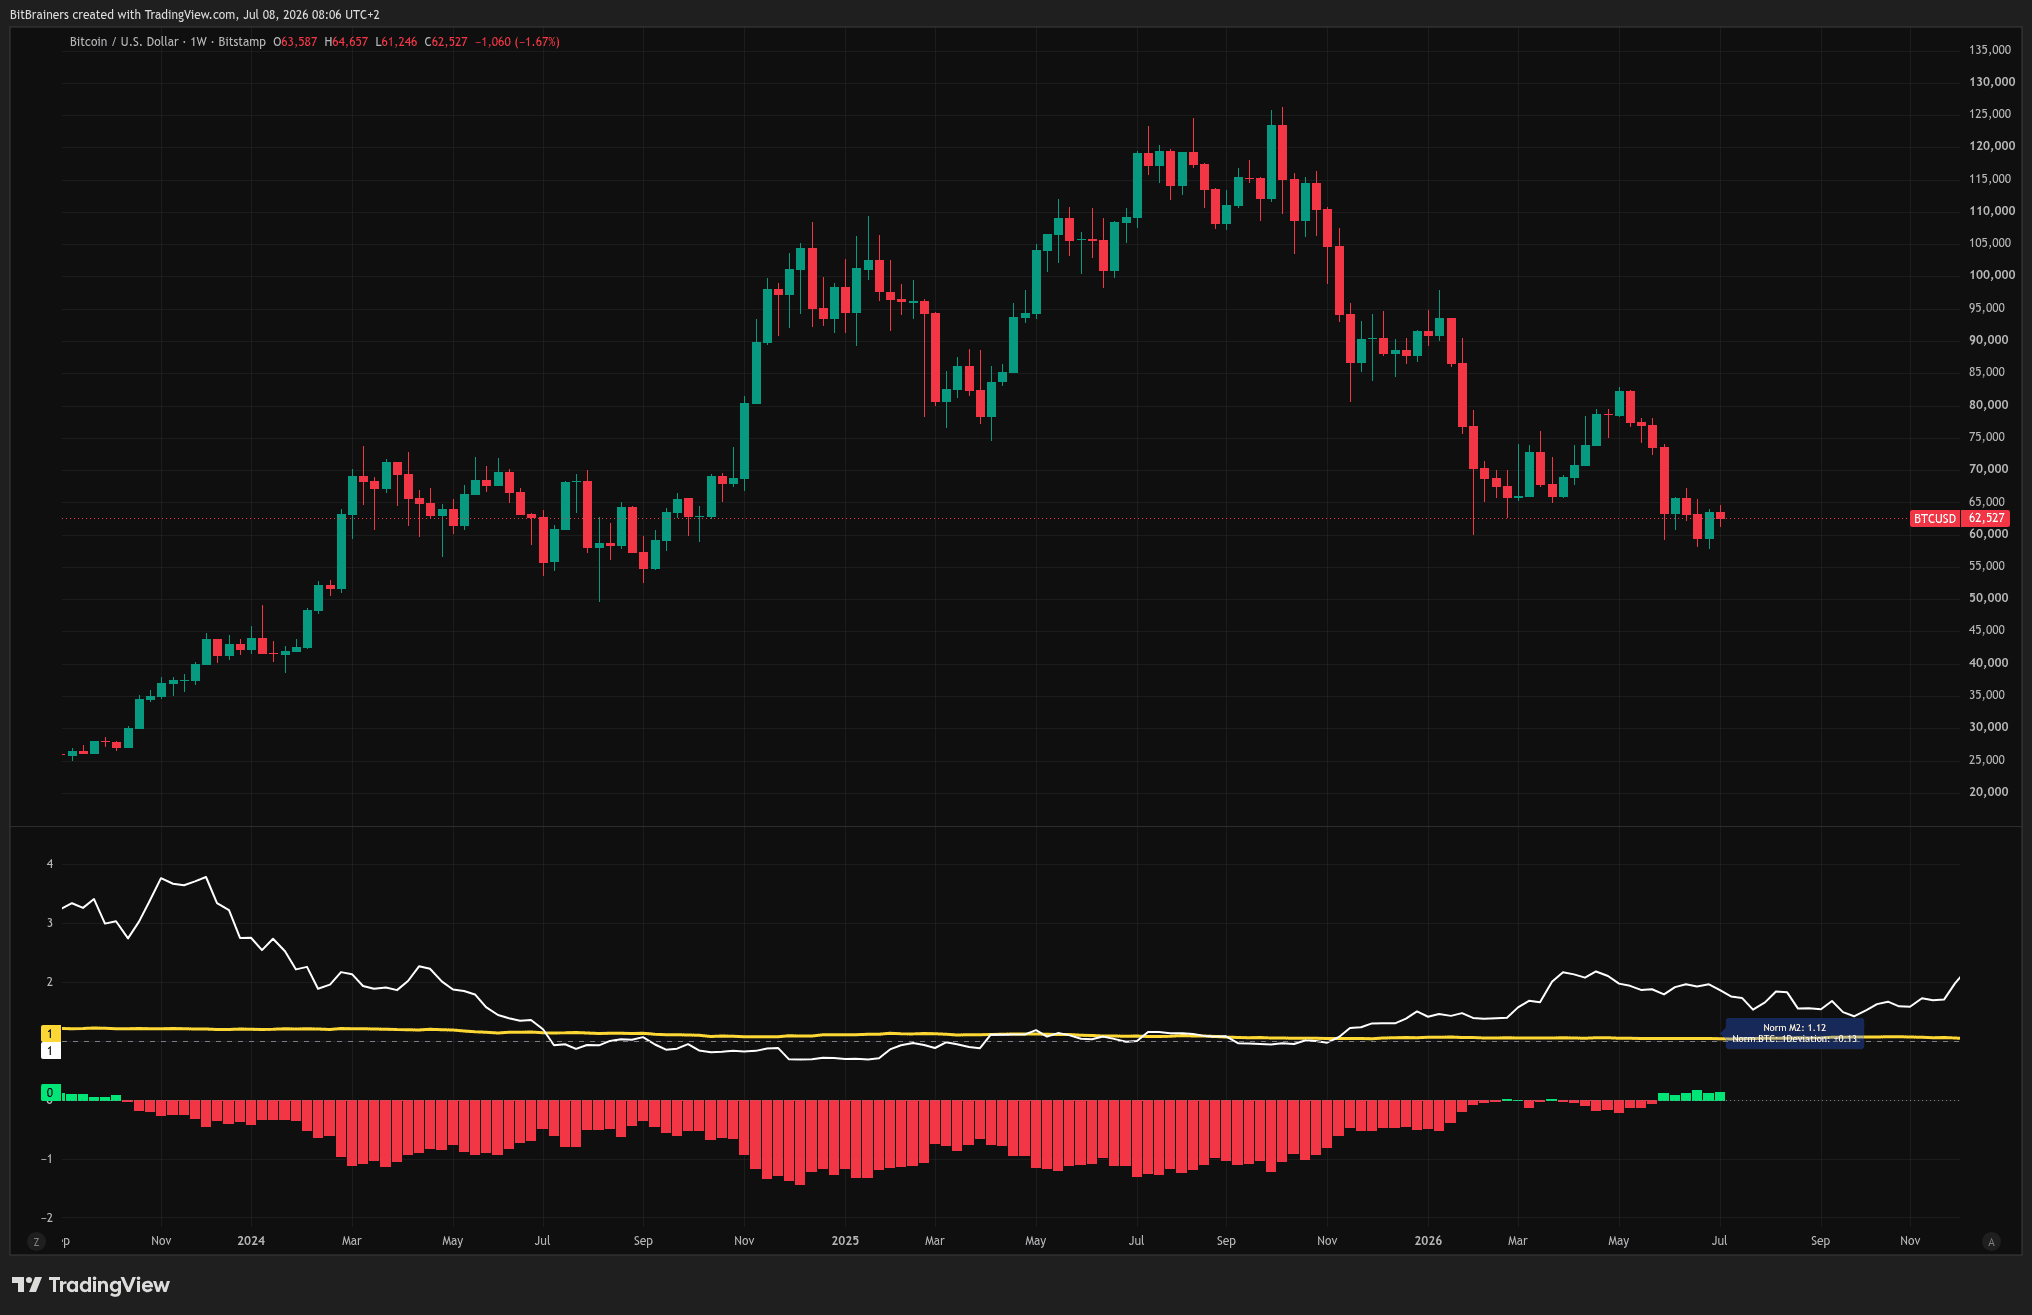
The clearest test of any liquidity-leads-Bitcoin thesis is what happens when the two stop moving together. That test is running right now. Research firm CF Benchmarks found the rolling four-year correlation between Bitcoin and global M2 held between 0.4 and 0.6 for years. By the fourth quarter of 2025, it broke down.
Over the trailing twelve months into early 2026, global M2 grew more than 12% while Bitcoin fell roughly 12% over the same stretch. Two assets that are supposed to move together went in opposite directions at the same time.
Gold did the opposite. It climbed close to 89% since early 2025, pushing past $5,000 an ounce, tracking the liquidity backdrop the way the theory predicts. CF Benchmarks' own fair-value scoring shows Bitcoin swinging from well above its M2-implied value in January 2025 to well below it a year later, while gold's equivalent score moved the other direction entirely. Whatever was chasing the liquidity-driven bid this cycle, it went to gold, not Bitcoin.
None of this proves the relationship is dead. Every prior divergence in Bitcoin's history has eventually closed, and CF Benchmarks itself frames this one as more likely a lag than a structural break. But "more likely" is a probability, not a guarantee, and a theory that needs a multi-quarter breakdown to still count as working isn't the tight mechanical relationship the 90-day countdown crowd is selling.
Where the Simple Version Breaks
The honest read: liquidity conditions matter to Bitcoin's price over long horizons. More money chasing a fixed supply of anything eventually shows up in the price. That mechanism is sound.
But eventually is doing a lot of work in that sentence. The specific timing sold as a trading signal, wait exactly 90 days then buy, is a far shakier claim than the underlying correlation it's built on. Regimes matter too. A relationship that holds during a liquidity expansion can go quiet during a tightening cycle, or during whatever is happening to Bitcoin right now while M2 keeps climbing without it.
Currency stress elsewhere complicates it further. The yen sitting near a four-decade low against the dollar right now is its own liquidity story, capital searching for yield outside a currency that keeps losing purchasing power. That's a separate channel into the same asset, and it doesn't run on the M2 calendar at all. We covered the mechanics of that spillover in Bitcoin Touched $64K and Pulled Back. Japan's Bond Yields Just Hit a 30-Year High.
What Actually Matters Here
Watching global M2 as one input among several is a legitimate lens. Setting a calendar reminder because an X thread said 90 days is trading a coin flip dressed up as a formula, and the current divergence between M2 and Bitcoin's price is a live demonstration of exactly that.
The correlation is real. The precision being sold around it isn't. Use M2 as a background read on liquidity conditions, not a countdown clock.
Sources:
Preprints.org / Journal of Economics and Social Dynamics: Pejvak Kokabian, "The M2-Bitcoin Elasticity: A Cointegration Analysis (2015-2025)"
CF Benchmarks: The M2-Bitcoin Relationship: What the Data Actually Shows
TradersPost: M2 Money Supply and Bitcoin Correlation, Explained
CryptoSlate: How M2 Money Supply and the Dollar Really Move Bitcoin Price
Disclosure: This is analysis and opinion, not financial advice. We hold positions in Bitcoin. Do your own research.