By BitBrainers Editorial
What drove that inflation drop? Largely gasoline. Energy prices pulled the headline number lower after a brief period of relative calm in the Strait of Hormuz, where a fragile interim agreement between the US and Iran had allowed some shipping to resume after months of conflict.
That agreement fell apart the same week Bitcoin was celebrating.
US and Iranian forces exchanged strikes from July 13 onward. Brent crude, which had dipped toward the low $70s during the ceasefire window, surged back above $85 by July 14-15. The exact energy prices that made the CPI print look soft are now reversing in real time.
The Relief Was Already Priced on Old Data
CPI measures the previous month. June's print described a world where Hormuz tensions had briefly eased and gasoline got cheaper. The July print will describe a world where they hadn't.
Bitcoin rallied on a data point that was already stale when it landed.
The Fed's new chair Kevin Warsh acknowledged this directly. Minutes from the June meeting flagged AI-driven energy demand as a new inflation wildcard. Warsh is also scheduled to testify before Congress this week. Traders parsing his tone for September signals will be doing so against a backdrop of $85 oil and contested shipping lanes.
The macro picture changes fast.
Get the weekly brief every Monday before the market opens.
SubscribeWhat the On-Chain Picture Actually Says
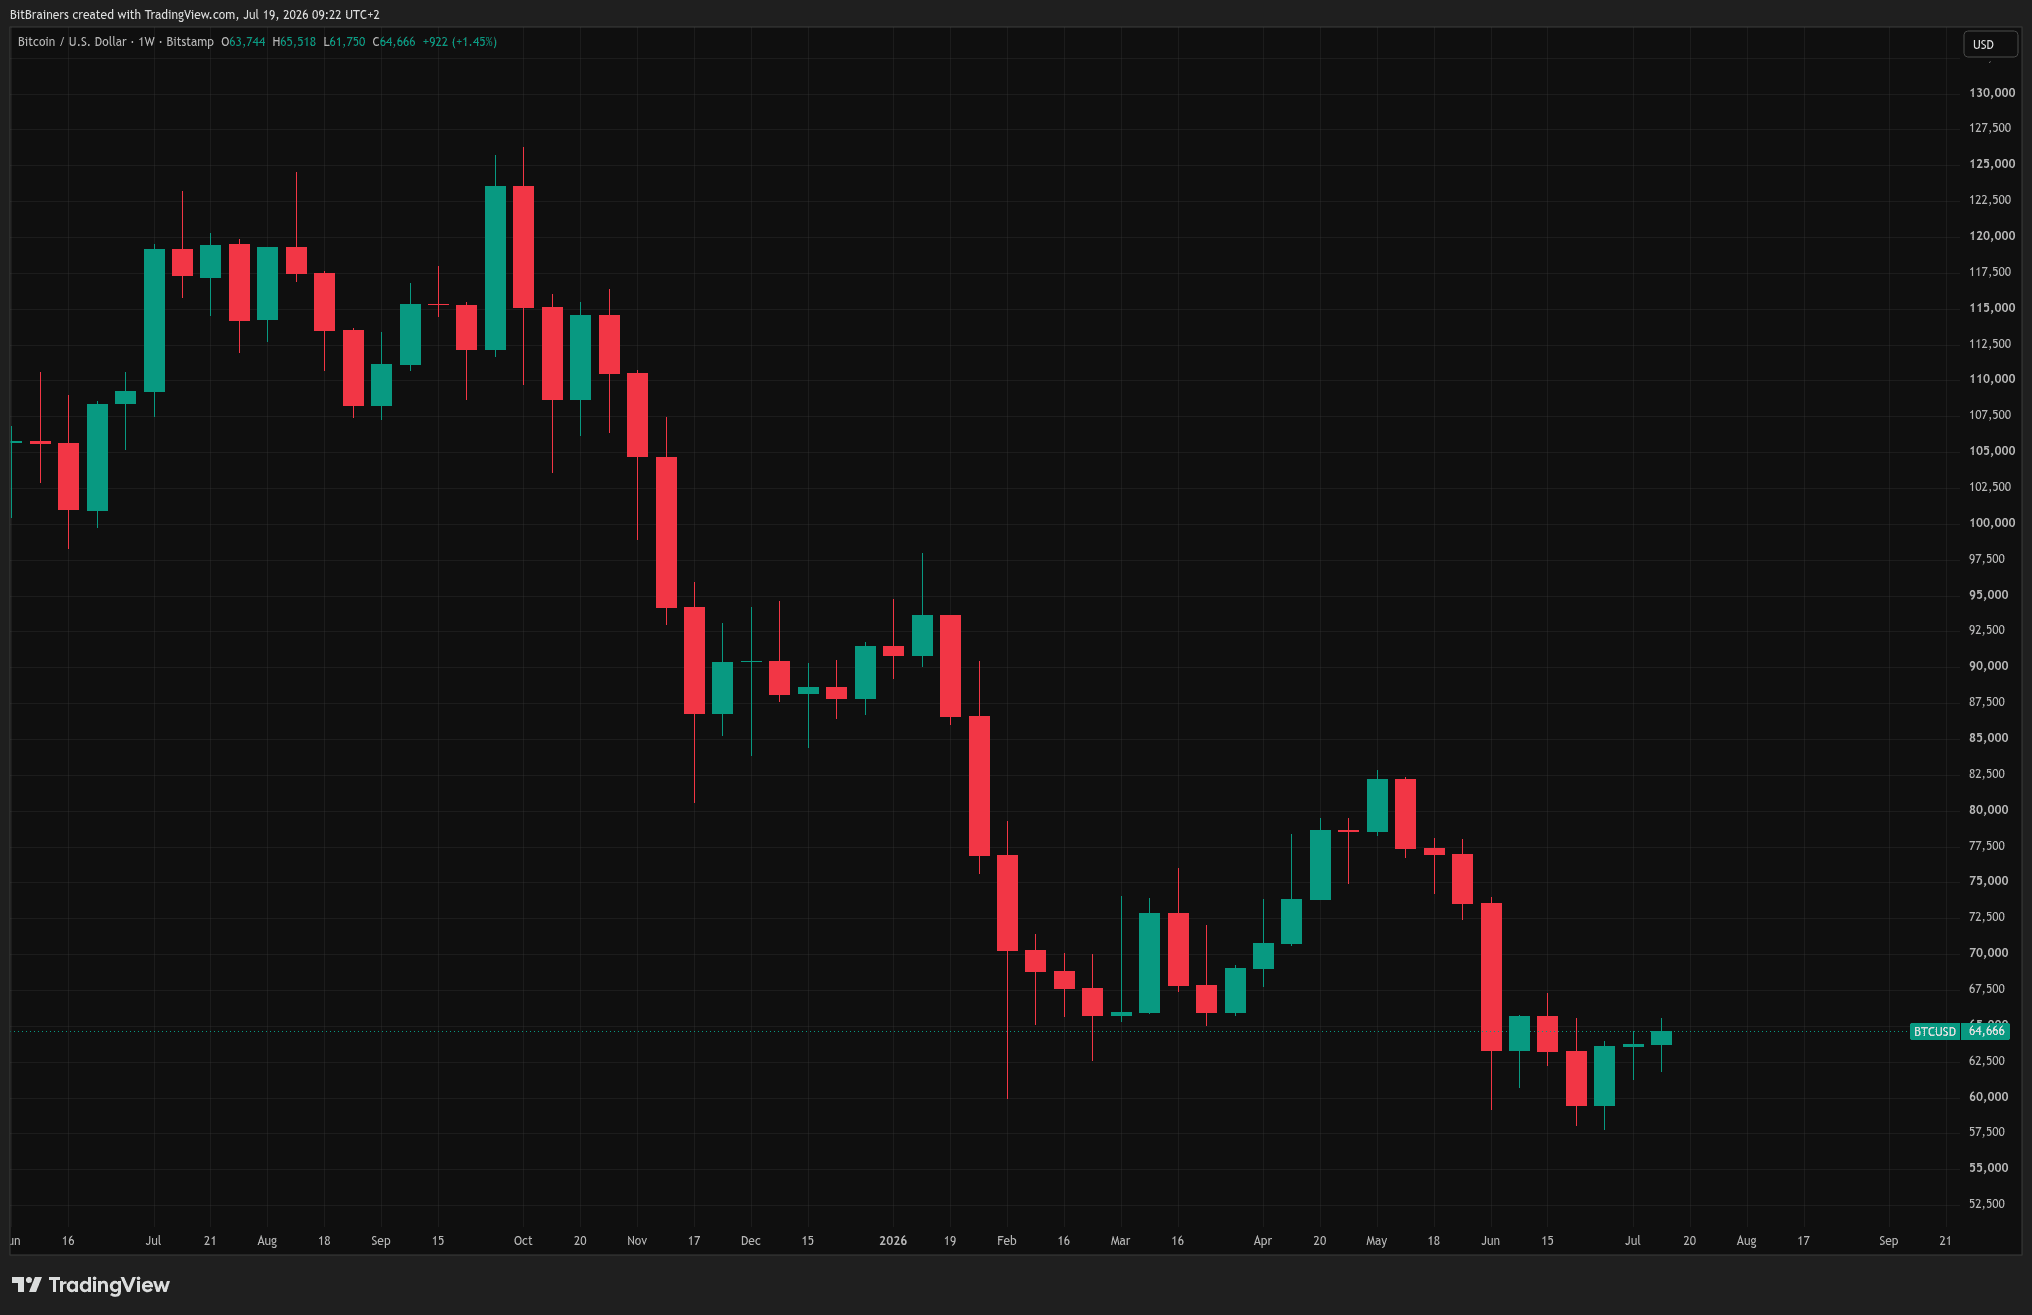
Beneath the CPI reaction, the structural picture is more interesting than the headline move. Whale addresses accumulated over 270,000 BTC near the $59,000 level in the two weeks before the bounce. Long-term holder supply is at record levels. Exchange reserves are at seven-year lows.
At the same time, the average spot ETF buyer entered around $83,800. With Bitcoin near $64,000, the typical ETF holder is sitting on an unrealized loss exceeding 23%. That gap explains why inflows have been sporadic. Buyers who are underwater tend to sell into strength rather than add.
This is not a normal distribution of holders. ETF products introduced a layer of institutional capital that tracks mandates and risk limits, not conviction. When real rates rise, those mandates force selling regardless of on-chain fundamentals. When real rates fall, the buying resumes. Bitcoin's price has become partially a function of interest rate expectations, not just adoption or scarcity.
Two forces pulling in opposite directions. Smart money accumulating on-chain. Institutional paper holders bleeding out through ETF redemptions. The feedback loop that defined 2024, where ETF inflows drove price and price attracted more inflows, is not functioning the same way in 2026.
Year-to-date net outflows from US spot Bitcoin ETFs stand at approximately $5.4 billion. June alone produced roughly $4.5 billion in outflows, the worst monthly reading since these products launched in January 2024.
The Bounce Has a Shelf Life
Bitcoin is a rate-sensitive risk asset in this cycle. The June CPI print did one specific thing: it removed the tail risk of a July hike. It did not open the door to cuts. Markets still assign roughly 70% odds to a hold on July 29, and prediction markets show around 76% odds of zero cuts across all of 2026.
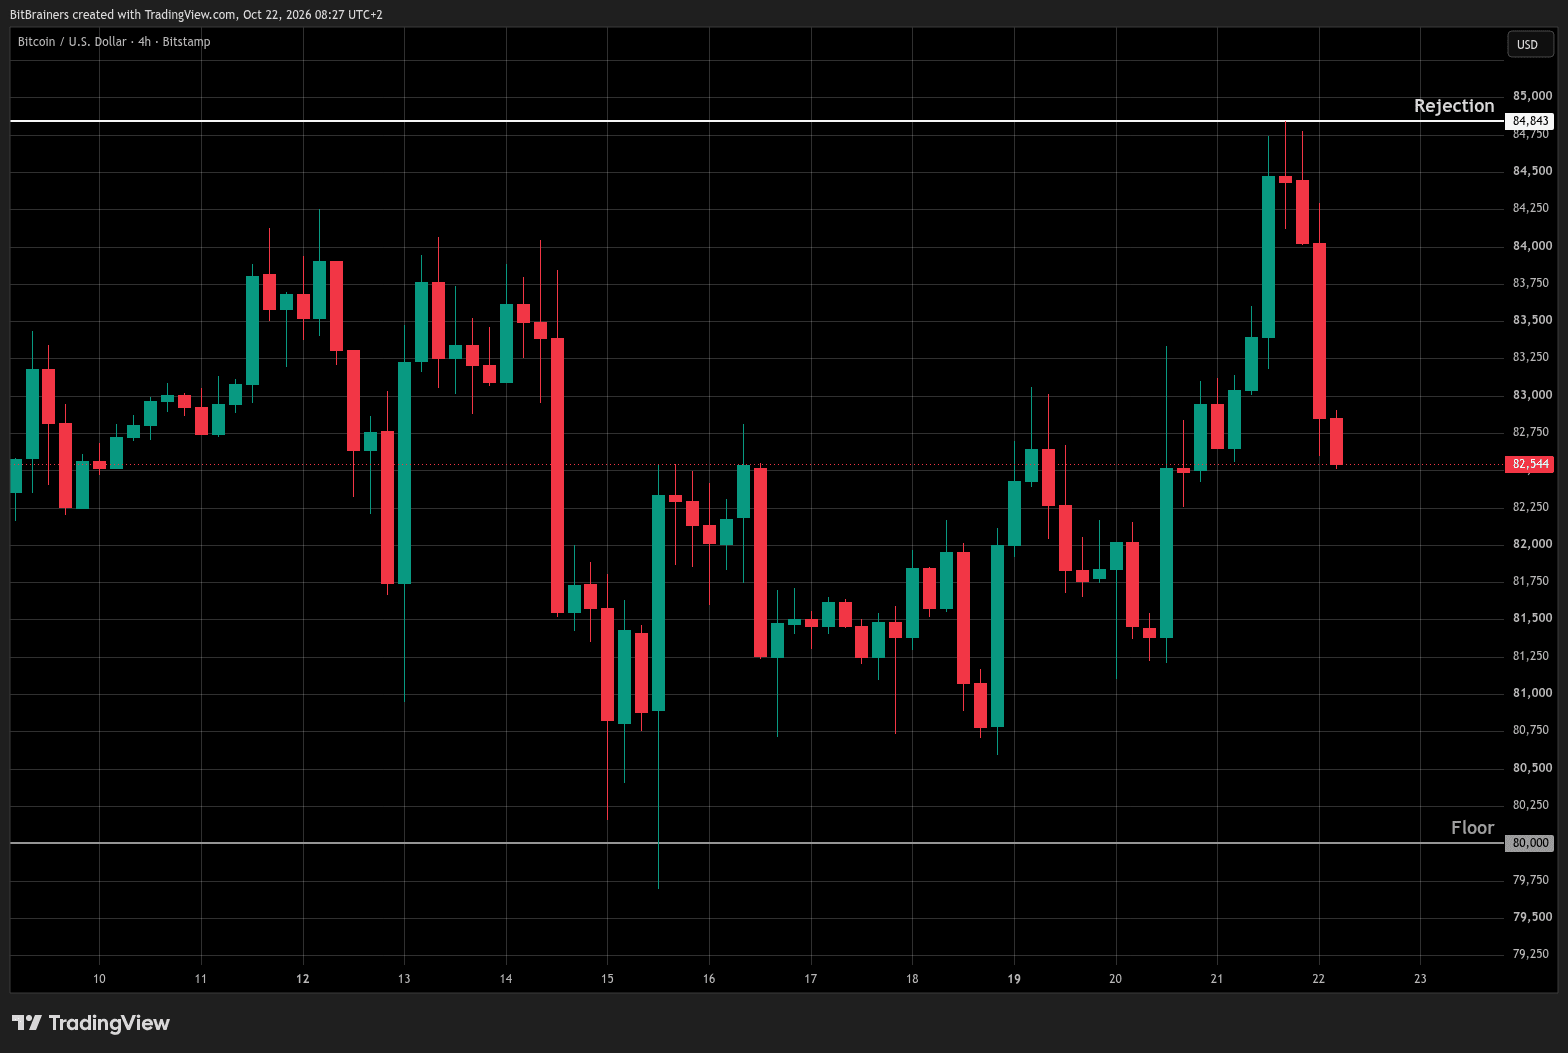
The ceiling has not moved. The floor got confirmed.
Part of the move was also mechanical. A short squeeze wiped over $230 million in leveraged positions across two sessions following the CPI and PPI prints. That amplified the price action. It does not mean the underlying bid is as strong as the candle size suggests.
Whether Bitcoin can hold above $65,000 into the July 29 FOMC meeting now depends on three variables: whether oil stabilises or pushes higher from here, whether ETF flows turn sustainably positive, and whether Warsh signals anything new on the September path.
One of those three is already moving in the wrong direction. Read our July CPI breakdown for the full macro setup going into FOMC.
On The Radar
Fed Chair Warsh testifies before Congress this week. July PPI landed July 15 below consensus, extending the inflation relief narrative for now. FOMC decision July 28-29 remains the next hard catalyst. Watch Brent crude. If it stays above $85 heading into August, the July CPI relief story starts to unwind before the Fed even meets.
Sources
Al Jazeera Oil prices hit 1-month high as US-Iran attacks dim Strait of Hormuz outlook
CNBC Oil prices today: Brent, WTI, Hormuz blockade
Phemex Bitcoin reclaims $64,000 after the softest CPI print of 2026
Memeburn Bitcoin price hits $64K as ETF outflows persist in July 2026
TechTimes Bitcoin breaks $65K on dual inflation miss
This is market commentary, not financial advice. Nothing here is a recommendation to buy or sell any asset. Do your own research.