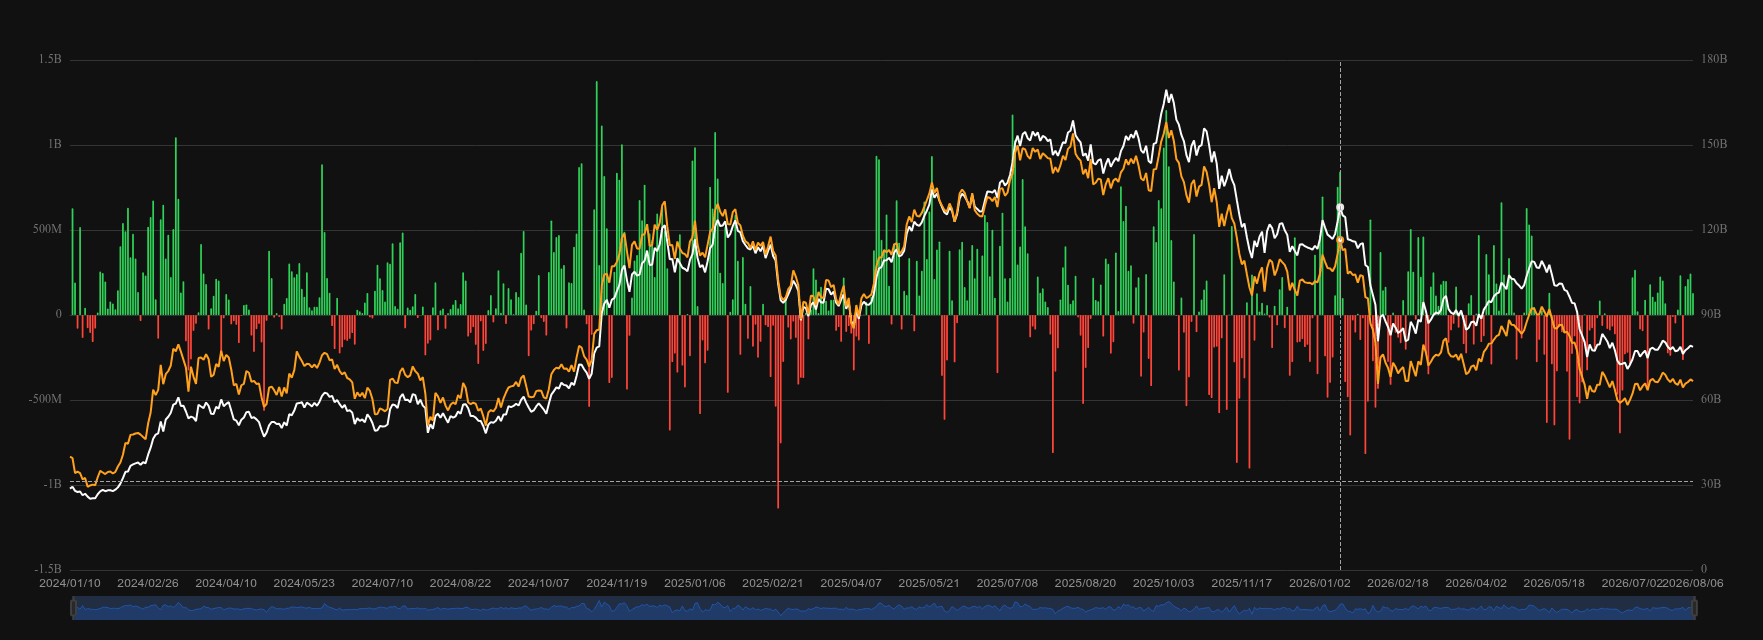
Spot Bitcoin ETF total net flows (green/red bars) and BTC price (orange line), January 2024 to August 2026. Source: SoSoValue.
By BitBrainers Editorial
The numbers are straightforward. On August 3, the complex took in $170.1 million: IBIT led with $111.4 million, Fidelity's FBTC added $33.4 million, and Franklin Templeton's EZBC bought $9.2 million, its first purchase in more than 30 days. On August 4, IBIT added $170.3 million and the complex printed $211.5 million total.
On August 5, IBIT led again with $196.8 million and the daily total reached $244.4 million, the strongest single day of the run. On August 6, IBIT added $128.3 million and the complex printed $137.6 million total despite outflows from HODL and GBTC.
The cumulative August total is now roughly $763.6 million. Total net assets across the complex sit at approximately $79 billion. Cumulative net inflows since January 2024 are approximately $51.9 billion. The year-to-date deficit, which stood at $5.4 billion after June's carnage, has narrowed to roughly $4.5 billion.
The Context
June produced $4.5 billion in outflows, the worst month since the ETFs launched. July recovered only $172.4 million. August has already added roughly $763.6 million in four sessions. That is a reversal, not a recovery, and reversals in ETF flows have been short-lived in 2026.
The last sustained inflow streak ran seven sessions from July 14 to July 22, totaling roughly $981 million. It followed a ten-day outflow streak that pulled $2.73 billion from the complex. The streak before that, in April, brought $2.44 billion and nearly doubled March's $1.32 billion. Each streak has been followed by renewed selling. The question is whether August is different.
What makes this streak notable is the breadth. On August 3, every major fund printed green. IBIT, FBTC, BITB, ARKB, BTCO, and EZBC all bought. That level of coordinated participation has not happened since April. On August 5, even ARKB added $37.6 million, a fund that had been bleeding for most of July. The only red days in August came from HODL and GBTC, both legacy products with structural outflow trends.
What the Flows Actually Say
IBIT's flow profile tells the whole story. Over the past four trading days, IBIT has taken in roughly $607 million. Over one month, it has lost approximately $1.83 billion. Over three months, $3.91 billion has left. The four-day figure recovers roughly a third of one month's outflows. The streak matters, but it has real ground left to cover.
The year-to-date picture keeps the bulls honest. The complex would need roughly seven more weeks at the current pace simply to return to flat for 2026. One session in early 2026 recorded $753 million in a single day. The current streak averages roughly $189 million per day. The capacity for large creations exists. What has been absent is the sustained sequence that converts individual green days into a trend.
The structural improvement is durability. The complex has now been through an $8.2 billion drawdown, a $2.73 billion ten-day outflow streak, and a 21-month price low without any product closing, any issuer exiting, or any operational failure. The infrastructure held, which is not a price catalyst but the kind of datapoint institutional allocators underwrite before they size up.
The NFP Test
Consensus expects 83,000 to 100,000 jobs for July. The unemployment rate is expected to hold near 4.2%. The Fed held rates at 3.50% to 3.75% on July 29 with three dissenters voting for a hike. Chair Kevin Warsh said the Committee is positioned to wait for more data. That data arrives in hours.
A print below 100,000 with rising unemployment increases cut expectations. Risk assets typically sell first on recession fears before recovering on liquidity hopes. Bitcoin's $64,000 area, trading near $64,300 as of this morning, faces its first real test since February. If the ETF bid is conviction, it holds through the initial volatility. If it is reflex, the streak breaks today.
A print above 150,000 with steady unemployment validates the three dissenters. The dollar strengthens. The recent ETF inflows look premature. The streak breaks for a different reason.
The Goldilocks zone, 100,000 to 150,000, leaves the Fed holding in September and the market shrugging. The streak continues because the macro ambiguity that created it remains intact.
Get the Weekly Brief
One email. Monday morning. The macro events that move Bitcoin this week.
SubscribeWhat to Watch
Watch the headline figure relative to 100,000. That is the threshold where recession pricing overtakes soft landing pricing.
Watch the unemployment rate. A tick to 4.3% or higher matches the highest level since late 2021.
Watch average hourly earnings. Sticky wages with weak jobs create the hardest outcome for the current policy framework.
And watch the ETF flow print for today. It will not be available until after the market close, around 4 PM ET. If the streak holds through an NFP miss, the institutional bid is real. If it breaks, the reflex trade is over.
For the full NFP preview and the Fed dissent context: yesterday's setup post
Sources
Farside Investors Bitcoin ETF Flow (US$m)
SoSoValue Bitcoin ETF Tracker
The Block Spot Bitcoin ETF Flows
Tools: Kraken for trading. Trezor for storage.
This is market commentary, not financial advice. Nothing here is a recommendation to buy or sell any asset. Do your own research.