The volatility index for Bitcoin just posted its biggest single-day surge since the February 5 crash. Not a mild uptick. Nearly 20% in one session. That kind of move in a fear gauge does not happen because traders are bored. Something shifted.
The question is not whether to pay attention. The question is whether you are reading this signal in the right direction.
A Nearly 20% Spike in Fear Is Not the Same as a 20% Drop in Price
Most retail traders see the word "fear gauge" and immediately assume doom. That is lazy pattern matching. The volatility index measuring Bitcoin's fear does not predict price direction. It measures expected turbulence. Fear can explode upward during a rally just as easily as during a crash.
What this spike tells you is that the options market just repriced risk aggressively. Traders buying protection. Premiums climbing. That behavior is what drives the gauge. It means uncertainty went up, not necessarily that price is going down.
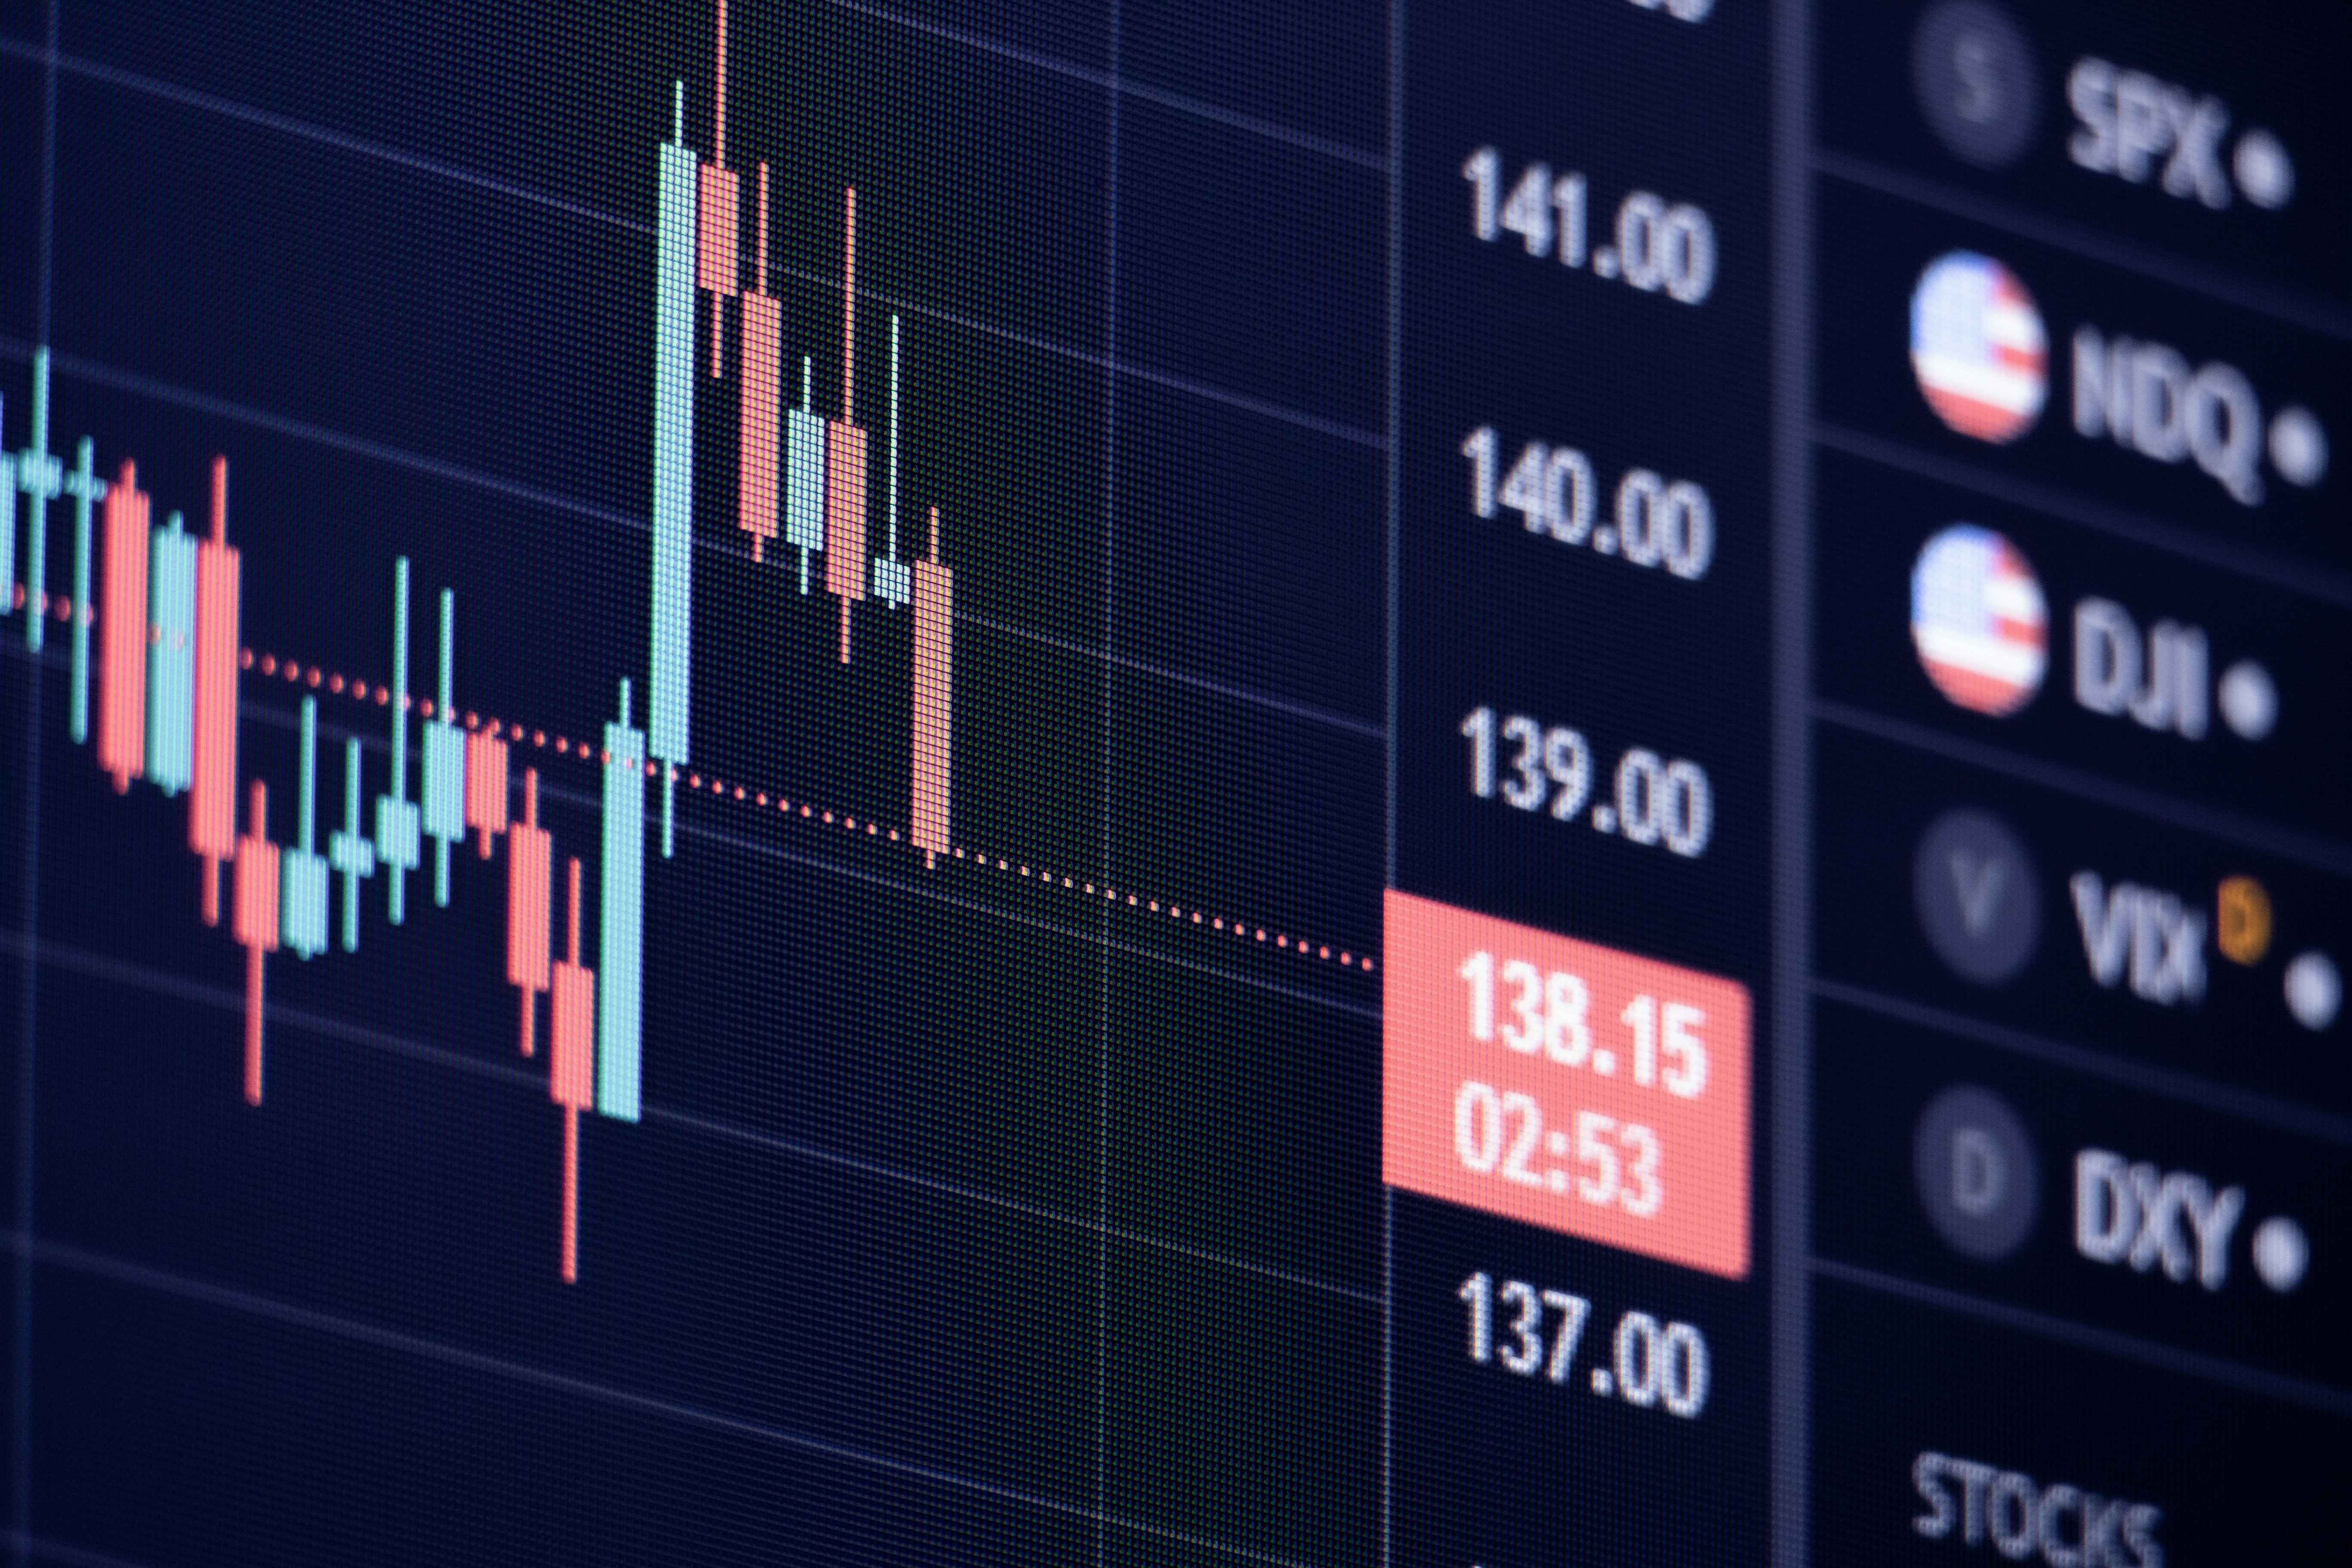
The distinction matters enormously when you are deciding whether to sit tight or start panic-selling at $67,075.
The February 5 Benchmark Is the Detail Everyone Is Glossing Over
The source anchoring this spike is the February 5 crash. That event was a significant dislocating moment for BTC. The fear gauge registering a move of comparable magnitude in a single session in early June means the market is pricing in something that feels, to institutional options traders, as threatening as that February event did in real time.
That should get your attention. Not because it guarantees a repeat, but because institutional options desks do not throw money at volatility premiums for fun. They are hedging against a specific set of scenarios they see as increasingly plausible.
When the last comparable spike was a day that actually preceded real pain, you do not get to wave this one off as noise.
Implied Volatility Spikes Are Often Front-Run by Smart Money
Here is something most people in crypto do not talk about enough. The fear gauge spike itself is often a lagging indicator of smart money positioning, not a leading one. By the time the gauge prints nearly 20% up, the large players who triggered it have already taken their positions. They loaded their hedges, bought their puts, and the gauge moved as a consequence.
Retail traders watching the gauge react to it after the fact. This is not unique to crypto. It is the same dynamic in traditional volatility markets. The spike you are seeing on June 3 reflects decisions that were made before the number was published. You are watching the exhaust, not the engine.
Short-Term Holders Are the Most Exposed Right Now
Bitcoin sitting at $67,075 is not a comfortable zone for everyone. Traders who bought in the last few weeks near recent local highs are already sitting on thin margins. When the fear gauge spikes nearly 20%, the psychological pressure on short-term holders intensifies fast.
This is the cohort that typically breaks first in volatility events. Not because they are weak, but because their cost basis gives them the least room before stop losses trigger or emotional selling kicks in. Long-term holders who have lived through the kind of drawdowns this asset routinely produces are far less likely to move at the first sign of fear gauge noise.
If you bought BTC recently and your position sizing was aggressive, this week is a good time to be honest with yourself about your actual risk tolerance, not the imaginary one you described when markets were calm.
Volatility Does Not Care About Your Support Levels
Traders love drawing horizontal lines on charts and calling them support. When the fear gauge spikes to its highest level since a confirmed crash event, those lines become suggestions, not floors. High implied volatility means options market makers are hedging larger gamma exposures, which means price swings can overshoot levels that held cleanly in low-volatility environments.
February 5 demonstrated this. Support levels that looked structurally solid got sliced through in hours. The market did not care about the lines. It cared about liquidity and forced selling. A nearly 20% fear gauge surge puts you in a regime where the same dynamics are back on the table.
The Contrarian Read Most Blogs Will Miss
Here is the angle that almost nobody is writing about right now. A fear gauge spike of this magnitude, when it occurs while price is not already in freefall, is sometimes a setup for a volatility crush. The market prices in a worst-case scenario. The worst case does not materialise. Implied volatility collapses. And assets that were sold down on fear rip higher.
This is not a prediction. It is a market mechanic. Volatility mean-reverts. When the gauge spikes nearly 20% without an equivalent price breakdown already in progress, you sometimes get a situation where the fear was the top of the fear, not the beginning of it. Watch what price actually does over the next 48 to 72 hours before you decide the spike confirmed a thesis in either direction.
What This Means for How You Are Holding Right Now
If you are holding meaningful BTC exposure and your keys are sitting on an exchange, a volatility spike this significant is a reminder that custody risk is real. Exchanges have had issues during high-stress market events in the past, from withdrawal freezes to platform instability. A hardware wallet like Trezor keeps your position yours regardless of what happens to the platform you traded on.
For active traders who want to navigate this kind of volatility on a platform that has held up through multiple high-stress market periods, Kraken is worth having in your toolkit. Having your infrastructure sorted before volatility peaks is not optional strategy. It is basic operational hygiene.
The Assumption You Probably Came In With Is Wrong
You probably came into this post assuming the fear gauge spike is a directional signal telling you to sell or to brace for a crash. It is not. It is a pricing mechanism that reflects how much uncertainty the options market is currently absorbing. The February 5 comparison is significant context, but context is not destiny. BTC at $67,075 with a spiking fear gauge is an environment that demands precision and patience, not a reflexive response in either direction. The traders who made money in February were not the ones who panicked fastest. They were the ones who waited until the signal clarified.
Watch This One Number Over the Next 72 Hours
The single most useful thing you can do right now is track whether the fear gauge holds elevated or begins to compress back. A sustained high reading with price deteriorating confirms the signal. A rapid compression of the gauge with price stabilising tells you the fear trade already exhausted itself. That divergence between the gauge and spot price is the actual signal worth acting on.
Do not trade the spike itself. Trade what happens next.
On The Radar This Week
The fear gauge spike is only meaningful if price follows. Watch whether Bitcoin holds $65,000 on a closing basis over the next 72 hours. A sustained break below that level on elevated volume confirms the signal. A rapid compression of the fear gauge with price stabilising tells you the fear trade already exhausted itself.
The BOJ June 15-16 meeting is the macro event that could turn this volatility into a directional move. Three board members pushed for an immediate hike to 1.0% at the April meeting. Markets are pricing that at 64.4% probability. Watch USD/JPY on the evening of June 14. Yen strengthening before the announcement is the carry trade unwind starting.
ETF outflows for May hit $2.30 billion, the largest monthly exit of 2026. Long-term holders trimmed 7.69% of their net position in the final week of May. Neither of those numbers has reversed yet. Until they do, fear gauge spikes are confirmations, not outliers.
Sources
CoinDesk. Bitcoin's 'fear gauge' surges nearly 20%, its biggest jump since Feb. 5 crash
BitBrainers. Follow the data, not the noise.
Disclosure: This post contains affiliate links to Trezor and Kraken. BitBrainers may earn a commission at no extra cost to you. This is not financial advice.
— BitBrainers Editorial