
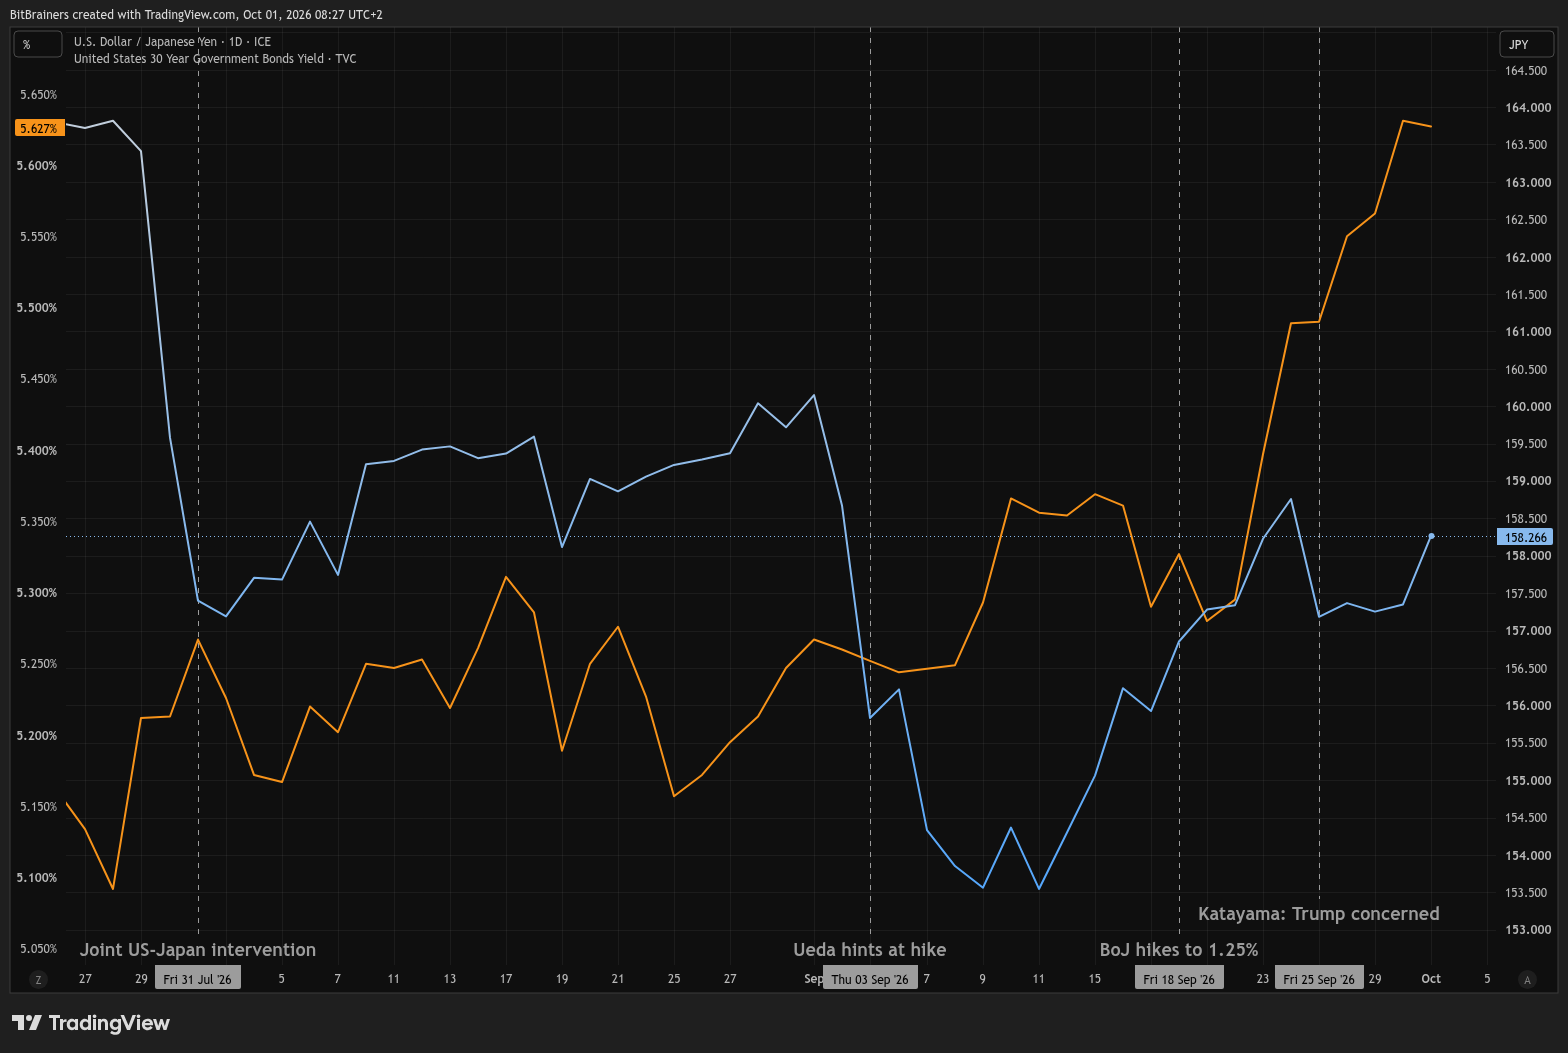
USD/JPY (light blue, right axis; higher means a weaker yen) and US 30-year Treasury yield (orange, left axis), daily, July 22 to October 1, 2026. Source: TradingView (ICE, TVC). Chart: BitBrainers.
By BitBrainers Editorial
Treasury yields are setting multi-decade records, and the speed matters as much as the level. The 10-year yield rose more than 50 basis points in September to close near 5.30%, and the 30-year topped 5.6%, last seen in 2002. Whether that is good or bad depends on who is holding the debt. Borrowers pay for it: mortgage rates are above 7%, and federal interest payments passed $1 trillion for the fiscal year. Savers and new bond buyers earn more. The reason behind the rise matters more than the level, and this week's candidate reasons do not all fit.
The selloff was global. Germany's 10-year went to 3.65%, its highest since mid-2009, and a global government bond gauge neared 4% for the first time since 2007. One explanation travelled fast. Ed Yardeni, president of Yardeni Research, called the yen carry trade unwinding as the Bank of Japan raises rates "a more likely explanation," and David Kass, a finance professor at the University of Maryland, passed the line on September 29. A single cause is a comfort when the damage is everywhere. It is also testable, and the yen is the place to run the test.
The test
September 2 to mid-September: the yen rallied. USD/JPY fell from about 160 on September 2 to about 153 by mid-September, a yen gain of roughly 4%, as Governor Kazuo Ueda's comments made a September hike close to certain and traders weighed Japanese repatriation. Japan's Ministry of Finance reported no purchases between August 27 and September 28. That was the market-driven leg. The earlier drop from 164 had help: Japan began buying on July 30 and Washington joined on July 31, part of the ¥15.4 trillion Japan spent between July 30 and August 26.
September 18, hike day: the yen sold off. The Bank of Japan raised its rate to 1.25% from 1.00%, a 7–2 vote and the highest since 1995. All 52 economists in Bloomberg's survey had expected it. An unwind buys yen. Everyone closing the trade needs the same currency at the same time. The yen finished weaker, near 156.9, and the 10-year JGB yield fell about 5 basis points to 2.947%.
September 23 to 30: a wobbling yen, rising yields. Through September 24 the yen weakened while the 10-year Treasury climbed from about 4.95% toward 5.27% by the 28th. On September 25, Finance Minister Satsuki Katayama disclosed that Trump had raised concerns about yen weakness at a summit with Prime Minister Sanae Takaichi earlier in the week, and the yen firmed from 158.60 to about 158 per dollar, Reuters reported. Yields kept rising. Jiji added that Katayama and Bessent have not ruled out further joint intervention. At the G20 earlier this month, Bessent told Ueda to take "decisive market and monetary steps," according to CNBC.
The last week
Bloomberg tied the September 28 move to rising oil and bets that the Fed keeps hiking. The FT headlined that oil and Treasury yields are in their tightest relationship since 1990. That is the war reaching the Treasury market through the oil ticker. Oil and the 10-year yield rose together from late August into mid-September. WTI then fell about 15% from its September 15 peak while the yield held its gains. The two rose together again from September 22 to 24 and split after that: from September 28 to 30 WTI fell about 3% while the yield rose roughly 5 basis points. On September 29 the 30-year made its 2002 high while WTI fell to a one-month low, and on September 30 yields kept rising after a soft PCE report cut October hike odds to about 37% from 51% a day earlier; they had been above 80% at one point this month.
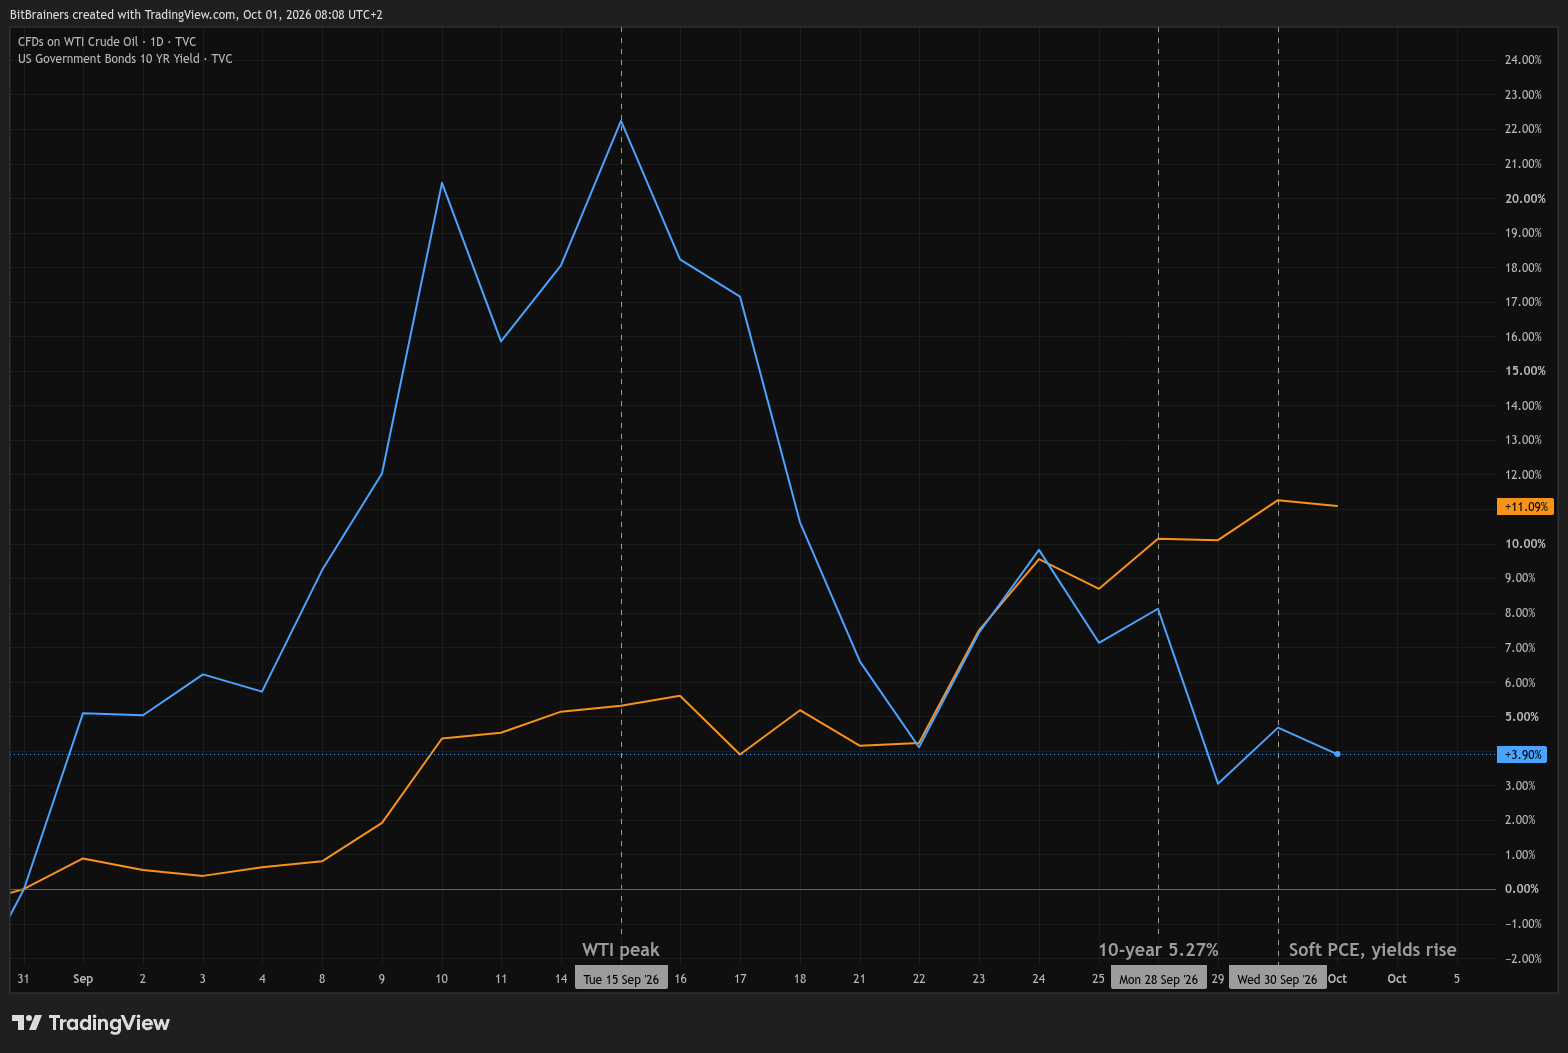
WTI crude (CFD, blue) and US 10-year Treasury yield (orange), percent change since August 31, 2026. Daily, through October 1. Source: TradingView (TVC). Chart: BitBrainers.
The carry story covers the first half of the month and stops at the hike. Oil covers the mid-September climb and the move from September 22 to 24, and not what came after. Neither fits the last week. What is left fits a US-driven selloff better than a yen-led one, with Japanese selling a contributor at the margin: a dollar supported by higher rates, and a Fed where 16 of the 18 officials who submitted projections see at least one more hike this year.
Japan is the largest foreign holder of Treasuries, at about $1.10 trillion in July, down from $1.24 trillion in February. Some of that is valuation. Holdings are marked at market prices, and yields rose. Custodial data cannot attribute holders exactly. Japan's own foreign securities holdings fell $87.8 billion in August, close to the scale of the intervention, and a ministry briefer said the intervention was a factor, so some official Treasury selling was likely. The August TIC release, due October 16, is the first print that can capture the intervention window.
The Weekly Briefing
One deep-dive every Monday. Derivatives positioning, key levels, and the macro events that move the week. $9 a month.
Subscribe on GumroadA yen rally that arrives while yields keep rising would be the unwind's missing evidence. So would a large drop in Japan's August holdings. The Bank of Japan meets October 29 and 30. A former BoJ executive director put back-to-back hikes at 20% to 30%; bets on an October hike eased on October 1 after the Tankan. On the US side, the September jobs report lands October 2, consensus near 84,000; ADP reported 90,000 private jobs for September. CPI follows October 14. CPI is the cleaner read. The BEA restated PCE on September 30 with three methodology changes that RBC estimated would cut core PCE by about 18 basis points.
The 10-year closed near 5.30% on September 30 and USD/JPY near 158.266. The ministry's purchase count for the yen's September rally was zero.
Sources (20)
David Kass on X | Yardeni on the yen-carry unwind
CNBC | Bank of Japan raises interest rates to 31-year high, 7-2 vote
Ministry of Finance | intervention operations, July 30 to August 26: ¥15,399.3 billion
Newsquawk | Japan currency intervention amounted to JPY 0, August 27 to September 28
Reuters via Yahoo Finance | Katayama discloses Trump's yen concerns, September 25
The Japan Times | Trump shared concerns over weak yen with Takaichi
Jiji Press via Nippon.com | further joint intervention not ruled out, September 25
Bloomberg | Bessent suggests backing for BOJ action in meeting with Ueda (Treasury readout)
Bloomberg | September 28: 10-year at 5.27% as oil lifts Fed hike bets
Financial Times | oil and Treasury yields in tightest relationship since 1990
CNBC | 10-year yield higher as traders look past inflation data, September 30
Yahoo Finance | Stock market today, September 30: October hike odds after PCE
The Japan Times | Japan likely sold Treasurys to fund record yen intervention
US Treasury | TIC major foreign holders, July
Bloomberg | ex-official Momma: back-to-back hikes at 20% to 30%
investingLive | BOJ opinions and tankan point to more hikes
ADP | September report: 90,000 private jobs
BEA | preview of the 2026 annual update, PCE methodology changes
RBC Economics | PCE deflator update: a retroactive revision
Investing.com | Germany 10-year yield history, 3.65% high on September 28
This post is for information only and is not financial advice. Figures come from the sources listed above. Do your own research before making any decision.

