Bank of Japan headquarters, Tokyo. Photo: Fg2 / Wikimedia Commons — Public Domain

Bank of Japan headquarters, Tokyo. Photo: Fg2 / Wikimedia Commons — Public Domain

Photo: © BrokenSphere / Wikimedia Commons — CC BY-SA

Multiple AI models just flagged Bitcoin as a high-probability continuation breakdown. The target prices vary. The consensus does not. Every model trained on historical crypto data is currently pointing in the same direction: lower.
Before you act on that, you should understand what those models actually learned and where they consistently fail.
When an AI analyzes Bitcoin price history, it is not reading charts. It is reading human behavior compressed into numbers. The 2018 crash from $20,000 to $3,200 is in there. So is the March 2020 COVID flush to $3,800. The 2022 collapse from $69,000 to $15,500. Every single one of those events was driven by the same mechanism: humans reaching a psychological threshold where holding became more painful than selling.
The AI learned that when RSI hits extreme lows, when ETF outflows accelerate, when sentiment reads Extreme Fear, prices tend to go lower before they go higher. That is what the training data shows. And right now, every one of those signals is firing simultaneously.
So the models output bearish targets. They are not wrong to do that. They are doing exactly what they were built to do.
Here is what no AI model trained on historical data can tell you: when the last seller sells.
Capitulation is not a technical event. It is a human one. It happens when the final wave of overleveraged longs gets liquidated, when the last retail holder who bought near the top finally gives up, when the news cycle shifts from "Bitcoin crashes" to "Bitcoin is dead" and the people who were going to sell have already sold.
That moment does not appear in the training data as a signal. It appears as the candle immediately before the reversal. The AI cannot see it coming because it has never been able to see it coming. Every bottom in Bitcoin history was invisible to the models until it was already over.
This is the part that does not get written about enough, because it is inconvenient for everyone selling AI-powered trading tools.
In November 2018, Bitcoin was at $6,000 and every quantitative model was projecting continuation to $3,000 or lower based on momentum, volume, and sentiment data. The models were right about direction for exactly six more weeks. Then Bitcoin found its floor at $3,200 and every model that had been confidently bearish had nothing useful to say about the reversal until it was already 40% complete.
In March 2020, Bitcoin dropped from $9,000 to $3,800 in 48 hours. Every algorithm designed to detect capitulation missed the actual bottom by days. The signals they were trained to recognize — sustained volume, RSI divergence, order book recovery — all lagged the actual price reversal by sessions. Traders following algorithmic signals bought back in after a 30% recovery from the low.
In June 2022, after the Luna collapse and the Three Arrows Capital implosion, sentiment was the worst it had been since 2018. Models trained on that 2018 data were projecting $10,000 Bitcoin. It bottomed at $15,500 in November and never saw $10,000 again. The models were wrong by 55% on the downside target.
The pattern is consistent. AI and algorithmic models trained on historical crypto data are reasonably good at identifying that a breakdown is in progress. They are systematically poor at identifying where it ends. The reason is structural: the data they were trained on does not contain the internal human experience of exhaustion that precedes a reversal. It only contains the price aftermath.
Think about what the training data actually represents. Every price bottom in Bitcoin history was created by humans who believed the price was going lower. They sold. The price went lower. More people believed it was going lower. They sold too. That cycle continued until it stopped.
The AI learned that pattern. Now it is applying it. But in doing so, it is potentially becoming part of the same cycle. When enough people read an AI prediction pointing lower and sell, the prediction becomes partially self-fulfilling. The model predicted human behavior and then influenced human behavior. The data that created the prediction is now being recreated by the prediction itself.
That is not a flaw. That is a feature of any widely distributed price prediction in a sentiment-driven market. And it is exactly why the most dangerous moment to follow an AI price model is when everyone else is already following it.
Here is the controversy nobody wants to engage with directly: if AI models are now sophisticated enough to move retail sentiment at scale, and retail sentiment is what creates the price data those models are trained on, then the models are no longer predicting markets. They are partially creating them. That feedback loop has no clean resolution and no one building these tools is publicly acknowledging it exists.
If you are holding Bitcoin right now and every AI model is telling you prices are heading lower, you have two choices. You can treat the prediction as information, or you can treat it as a mirror.
As information it tells you: historical patterns suggest further downside. RSI, sentiment, and flow data are aligned bearishly. Risk management matters here.
As a mirror it tells you something more uncomfortable: you are currently inside the exact psychological setup that created every Bitcoin bottom the AI was trained on. The discomfort you feel reading a bearish AI prediction is the same discomfort felt by every person who sold at the bottom of every previous cycle.
The AI is not predicting a crash. It is predicting that you will behave the way humans have always behaved at this point in the cycle. Whether you do is entirely up to you.
For anyone navigating this with real Bitcoin holdings, cold storage removes exchange risk entirely regardless of what happens on any platform during a flush. A Trezor hardware wallet means your stack stays yours. That is not a trade recommendation. It is basic asset hygiene at a moment when counterparty risk becomes real fast.
If you are actively trading around these levels, Kraken remains one of the more reliable platforms for execution when volatility is high.
Disclosure: This post contains affiliate links to Trezor and Kraken. BitBrainers may earn a commission at no extra cost to you. This is not financial advice.
BitBrainers. We check the facts so you don't have to.
Sources
Finbold — AI Bitcoin price prediction, June 2026
BeInCrypto — Bitcoin ETF outflow data, May 2026

$3 billion just walked out of Bitcoin ETFs. The stock market is printing all-time highs. And Bitcoin is sitting at $66,563, looking like the kid not invited to the party it helped throw.
This is the current setup as of June 3, 2026. It is uncomfortable. It is also worth paying close attention to, because the story most people are telling about this moment is wrong.
When equity indices are ripping to record highs and Bitcoin is choking below $67K simultaneously, traders tend to split into two camps. One screams "the bull run is over." The other screams "altseason incoming." Both are missing the actual signal.
Bitcoin has historically moved with risk assets when institutional flows drive both markets. Right now, institutional money is rotating hard into traditional equities. The all-time highs in stocks are not happening despite the crypto selloff. They are partly happening because of it.
Capital is finite. When one bucket fills, another empties.
The $3 billion in Bitcoin ETF outflows that Yahoo Finance reported this week is a real number, and it demands context. These are not retail traders panic-selling on Coinbase. These are institutional allocators rebalancing. They pulled from Bitcoin ETFs and almost certainly redeployed into equities that were running.
That is a mechanical portfolio management decision, not a verdict on Bitcoin's future. A fund with a 60/40 model does not sit on crypto gains when the S&P is breaking records. It trims. It rebalances. It does its job.
This is not capitulation. This is housekeeping.
Here is what most crypto blogs will not tell you: the Bitcoin ETF structure gave institutional investors a clean, regulated way to get in and out of Bitcoin exposure without ever touching a wallet. That efficiency cuts both ways.
Before spot ETFs existed, institutional money entering crypto was stickier. Moving large sums through custody arrangements, OTC desks, and compliance frameworks took time. Now a fund manager can rotate $500 million out of BTC exposure before lunch with a single order on a regulated exchange. The same product that opened the floodgates on the way in has now opened them on the way out.
The ETFs did not betray Bitcoin. They just revealed how institutional capital actually behaves.
$66,563 is not a crash. People calling this a crash either started in crypto last year or have a short position to defend. Bitcoin has survived drops that make this look like a parking ticket.
What this price level does represent is a real test of a support zone that the market has been negotiating for weeks. If buyers defend this area with conviction, the chart sets up for a re-test of higher levels. If they do not, the next meaningful support cluster sits lower and every headline will scream "crypto winter" with maximum drama.
Watch the daily close. Not the hourly candle, the daily close.
Everyone is treating equity all-time highs as the reason Bitcoin is struggling. The contrarian case is the opposite: equity all-time highs are the condition that historically precedes Bitcoin's next major move higher.
When stocks are overextended and institutional portfolios are stuffed with equities that have run far, fast, the rebalancing eventually goes the other direction. Funds that trimmed Bitcoin to buy equities at the top will need to rebuild their crypto exposure when equities correct or plateau. That rotation has played out multiple times in the modern crypto cycle, and the setup today looks structurally similar to each prior instance.
Bitcoin does not move with stocks forever. It moves in phases, and right now we are in the phase where traditional finance feels like the obvious winner. That phase ends.
Here is the insider-level detail that gets buried in ETF flow reporting: single-day or single-week outflow numbers rarely tell the full story because ETF flow data often lags by 24 to 48 hours and sometimes reflects redemptions that were triggered by institutional hedging strategies rather than pure directional bets against Bitcoin.
A fund might pull from a Bitcoin ETF on Tuesday not because they are bearish on BTC, but because they need to cover a loss elsewhere in the portfolio. The Bitcoin position was liquid. It got hit. That shows up in the outflow data and gets reported as "institutions fleeing Bitcoin." The reality is messier and less dramatic.
Never read a single data point in isolation. Always ask what the counterparty needed.
When Bitcoin is under pressure and sentiment is shaky, scam activity accelerates. Phishing attempts, fake support accounts, and compromised exchange logins spike during periods of fear because bad actors know people are emotional and less careful.
If your Bitcoin is sitting on an exchange right now, that is a decision worth reconsidering. Moving long-term holdings to cold storage using a device like a Trezor hardware wallet removes the exchange counterparty risk entirely. You are not trusting a company's security team. You are trusting math and your own custody.
That is not paranoia. That is how this asset class works.
If you are actively trading this range rather than holding, execution quality and security matter more than ever at choppy price levels. Kraken has consistently ranked as one of the more reliable platforms when markets get volatile and liquidity gets tested, which is exactly the environment we are sitting in right now.
Slippage at $66K support levels is not a theoretical problem. It is a real cost that eats into every trade you take.
You probably came to this post thinking the Bitcoin weakness and Wall Street strength are in conflict with each other. They are not. They are two sides of the same institutional rotation trade, and the moment that trade reverses is the moment everyone watching equities will suddenly start paying attention to Bitcoin again.
The divergence you are seeing right now is not a warning that crypto is finished. It is a reminder that Bitcoin operates on its own cycle, and that cycle has never permanently synced with traditional markets. The $3 billion that left ETF products this week is not gone. It is parked somewhere else, waiting for the next rotation signal.
Watch where the equity risk appetite goes next. That is your leading indicator for Bitcoin's next move.
Bitcoin needs to reclaim $68,000 to neutralize the current breakdown. Next meaningful support sits at $64,800 if sellers stay in control. The S&P 500 printing all-time highs while Bitcoin slides below $66,000 is the most important divergence to watch this week.
FOMC minutes drop Wednesday. Dollar strength at DXY 104 remains the macro variable most likely to determine whether this dip finds a floor or deepens. Risk assets including crypto do not trade in a vacuum when the dollar is this strong.
The CLARITY Act is now on the Senate Legislative Calendar. A floor vote before the July 4 recess would be the most significant regulatory catalyst crypto has seen in years. Watch for vote timing announcements this week.
Disclosure: This post contains affiliate links to Trezor and Kraken. BitBrainers may earn a commission at no extra cost to you. This is not financial advice.
Sources
Yahoo Finance. $3 billion leaves Bitcoin ETFs. Why Wall Street isn't panicking.
BitBrainers. We check the facts so you don't have to.
— BitBrainers Editorial
Eighty-six percent. That is how much of the liquidation wave from Bitcoin's breakdown below $68,000 came straight out of long positions. Not a balanced flush. Not a healthy reset. A one-sided massacre of traders who were positioned for a breakout that never came.
This is not a surprise if you know how to read the setup. But most people did not read it. And now they are learning the expensive version of that lesson.
When Bitcoin sat just below $68,000 resistance, social sentiment was running hot. Retail traders were loading longs, convinced ETF momentum and macro tailwinds would push price through that level cleanly. That conviction created a very specific kind of fuel. Not bullish fuel. Liquidation fuel.
When the majority of open interest is stacked long on one side of the book, price does not need a catastrophic event to reverse. It just needs enough selling pressure to trigger the first round of stops. After that, the liquidations do the work themselves. Cascades are mechanical, not emotional.
The 86% long liquidation figure from this breakdown makes that dynamic impossible to ignore. This was not a bear market ambush. This was a crowded trade that got run over by its own weight.
Here is something that gets glossed over in mainstream crypto coverage. ETF inflows can create buying pressure, but they do not create a permanent price floor. Institutional products introduce a new layer of market participants who respond to completely different triggers than crypto-native traders.
When a traditional fund manager sees BTC underperform or faces redemption pressure from their own investors, they sell. They do not hodl through a 10% drawdown because they believe in the technology. They manage risk according to mandates, not conviction. That selling pressure does not disappear just because the product is called a Bitcoin ETF.
The narrative that ETF adoption equals permanent upward pressure on BTC is exactly the kind of oversimplification that gets retail traders liquidated. ETF pressure, as this breakdown shows, cuts both ways. Right now, according to the source data, that pressure is contributing to BTC's difficulty holding above $68K rather than propelling it through.
Most people do not know this: the $68,000 to $70,000 range has been a graveyard for leveraged longs across multiple attempts. Each time price approaches that band, the open interest on long positions builds up like pressure behind a dam. Market makers and larger players can see that aggregated positioning data. They know exactly where the stops are clustered.
This is not conspiracy. It is publicly visible data on derivatives platforms. The stops are there. The liquidity from those stops is attractive. And when volatility spikes, that zone becomes a hunting ground. The 86% long-dominant liquidation breakdown you just watched play out follows a script that has repeated itself every time BTC stalls at a key resistance level with maximum long bias in the market.
If you are using a platform like Kraken and you are trading with leverage, understanding where your stop sits relative to the broader open interest cluster is not optional. It is the difference between surviving a flush and being the liquidity someone else needed.
Do not get smug if you are holding spot and have no leveraged positions. A cascade that wipes out leveraged longs also pulls spot price down with it. Your cost basis matters. If you loaded up near $68K to $70K expecting a clean breakout, you are sitting in unrealized loss territory right now regardless of how you structured the trade.
The distinction between leverage and spot becomes less meaningful when you are trying to decide whether to hold through a breakdown or cut. Spot gives you time and removes the forced liquidation risk. But it does not insulate you from a sustained downtrend if the structure shifts.
Custody discipline matters more during volatile periods than any trade setup. If you are holding significant BTC through this kind of drawdown, get it off exchanges. A hardware wallet from Trezor removes exchange-side risk entirely while you wait for the market to resolve. That is not optional advice during a flush. It is basic asset hygiene.
Here is the take most crypto media will not publish because it disrupts the bullish narrative cycle. Mass long liquidations at key resistance levels are sometimes the most structurally healthy thing that can happen to a market. Not because pain is good, but because it removes the overleveraged dead weight that was preventing price discovery from functioning cleanly.
After a flush like this, the market tends to find a more honest level. The forced sellers are gone. The weak hands got washed. What remains is a cleaner open interest picture where price movement reflects genuine conviction rather than compounding leverage. Paradoxically, an 86% long liquidation event can set up the next real leg better than any bullish catalyst announcement.
That does not mean buy the dip blindly right now. It means stop reading this event as exclusively negative. Read it as a reset.
The immediate thing to track right now is not price candles. It is ETF net flow data. If institutional products start showing sustained outflows following this breakdown, the bid underneath spot gets weaker and the $68K level becomes a ceiling rather than a floor.
If flows stabilize or reverse, that changes the picture. BTC at $67,291 sitting below a resistance level it just failed to clear tells you nothing on its own. The ETF flow story is what tells you whether the buyers with real capital are stepping back or holding their position.
Watch the 72-hour window following this breakdown. That data will give you more signal than any technical indicator on a 4-hour chart right now.
Most traders reading this came in assuming the lesson here is about leverage management. Use less leverage. Tighter stops. Basic risk hygiene. That is all true but it misses the bigger point entirely. The real assumption to challenge is that resistance levels are obstacles price needs to push through. Sometimes a failed breakout followed by a liquidation cascade is the market telling you the structure is not ready. Fighting that signal with fresh leverage in the opposite direction after a flush is how the second wave of liquidations gets built. Patience is a position.
Bitcoin needs to reclaim $68,500 before bulls have any case to make. Failure there keeps $65,000 in play as the next meaningful support. Watch whether price can close a daily candle above $68K — that is the first confirmation signal worth paying attention to.
ETF flow data over the next 72 hours is the most important indicator right now. Eleven straight days of outflows totaling $3.45 billion. If that streak continues into next week, the bid underneath spot gets meaningfully weaker. If flows stabilize or reverse while price holds, the flush may be complete.
The CLARITY Act resumes Senate negotiations this week. A vote or meaningful progress before Friday would be the most significant macro signal crypto has seen in 2026 regardless of where BTC is trading.
Disclosure: This post contains affiliate links to Trezor and Kraken. BitBrainers may earn a commission at no extra cost to you. This is not financial advice.
Sources
Bitcoin.com. 86% Long Liquidation Wave Exposes Bitcoin's Breakdown Below $68K as ETF Pressure Builds
BitBrainers. We check the facts so you don't have to.
— BitBrainers Editorial
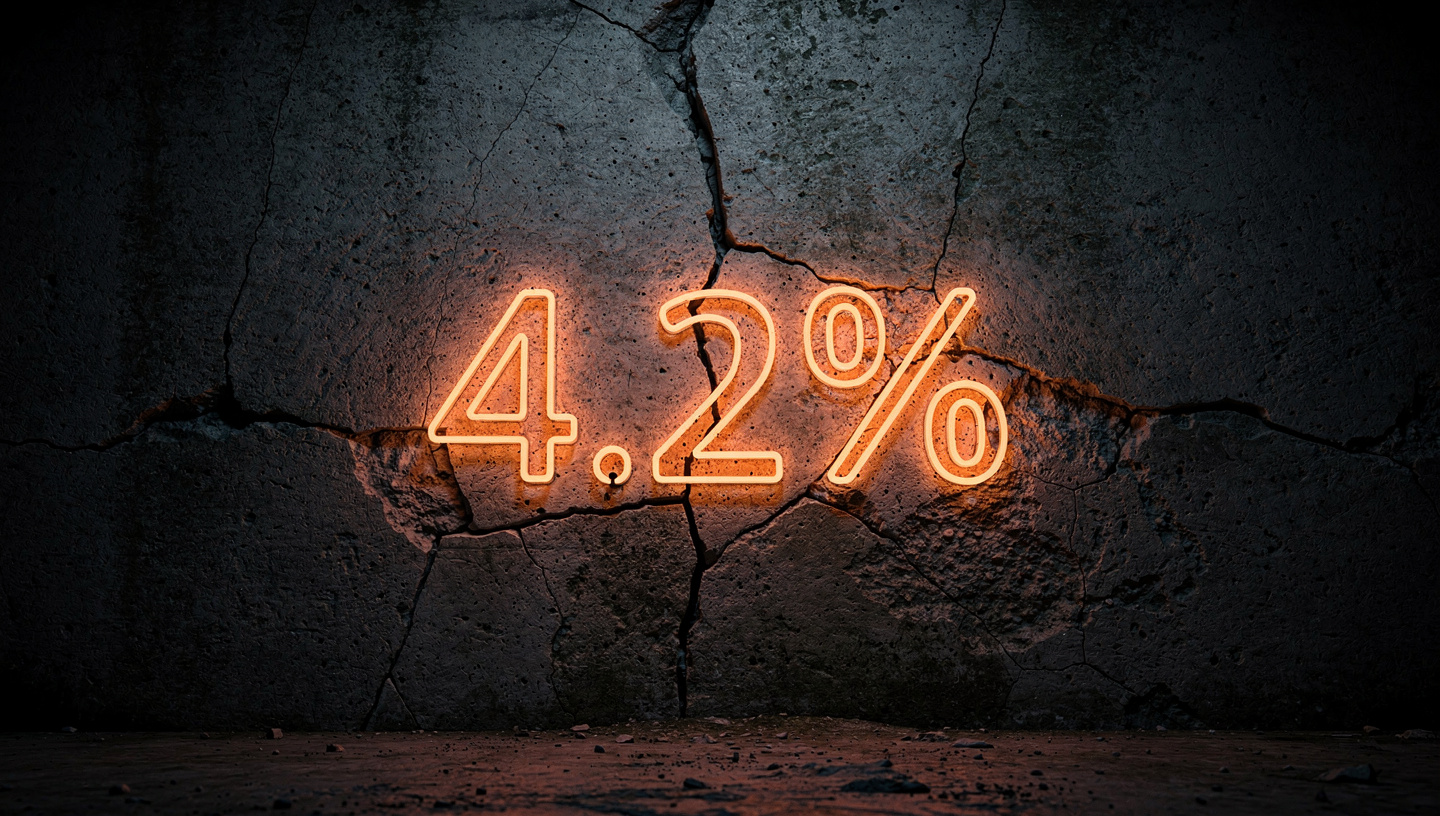
US CPI May 2026: The most important inflation print of the month drops today. Source: Leonardo.ai At 8:30 AM Eastern today, the Bureau o...