

Welcome back to Bot Signal Watch, the weekly report where we publish exactly what our automated trading bot did, with nothing polished and nothing hidden. This week the series records its first closed trade, a loss, and two fresh long signals that fired the same day we published a post arguing that Bitcoin's bottom is not in. Both of those things can be true at once, and explaining why is the most useful thing this series has covered so far.
Quick recap for new readers. The bot runs an EMA21/EMA55 crossover strategy on the 15-minute chart, scanning the market every 15 minutes around the clock. A long fires when the fast average crosses above the slow one, with RSI and volume filters that can veto the entry. It currently runs in dry-run mode, meaning it logs every signal as if it were trading while we validate the strategy on live market data instead of backtests. New this week: ETH signals are now logged alongside BTC.
Read also: Bitcoin Hasn't Bottomed Yet and There's One Dead Simple Way to Prove It
Last Week's Signals: First Trade Closed, and It's a Loss
Week one left two trades open, and the deal with this series is that we report how they end. The June 10 SHORT from $61,312 is the series' first closed trade: today's spike toward $64,400 ran straight through its stop loss at $64,378. Closed at minus 5 percent. We flagged this exact weakness in week one, a short fired six hours after a long in a chopping market, and the market collected on it.
The June 10 LONG from $62,004 is still open and sitting around plus 2.7 percent as of writing, with its take profit at $65,724. Series record so far: four signals fired, one closed, one loss, running total minus 5 percent. Not a glamorous start, and that's exactly why these numbers get published.
The New Signals: Two Longs on Bounce Day
Since the June 10 pair, the log showed one line on repeat: no signal, no EMA cross. Price chopped between the week's low and the mid $63,000s without a sustained trend, and the averages stayed glued together. Then today the buying held long enough to cross them.
At 11:17 the bot fired a long on BTC: entry $63,539, take profit $67,351 (+6%), stop loss $60,362 (-5%). At 17:04 ETH followed: entry $1,679.53, take profit $1,780 (+6%), stop loss $1,595 (-5%). Both are dry-run signals, no real money attached, and both are open as of writing. We'll report how they resolved next week, wins or losses, because that's the deal with this series.
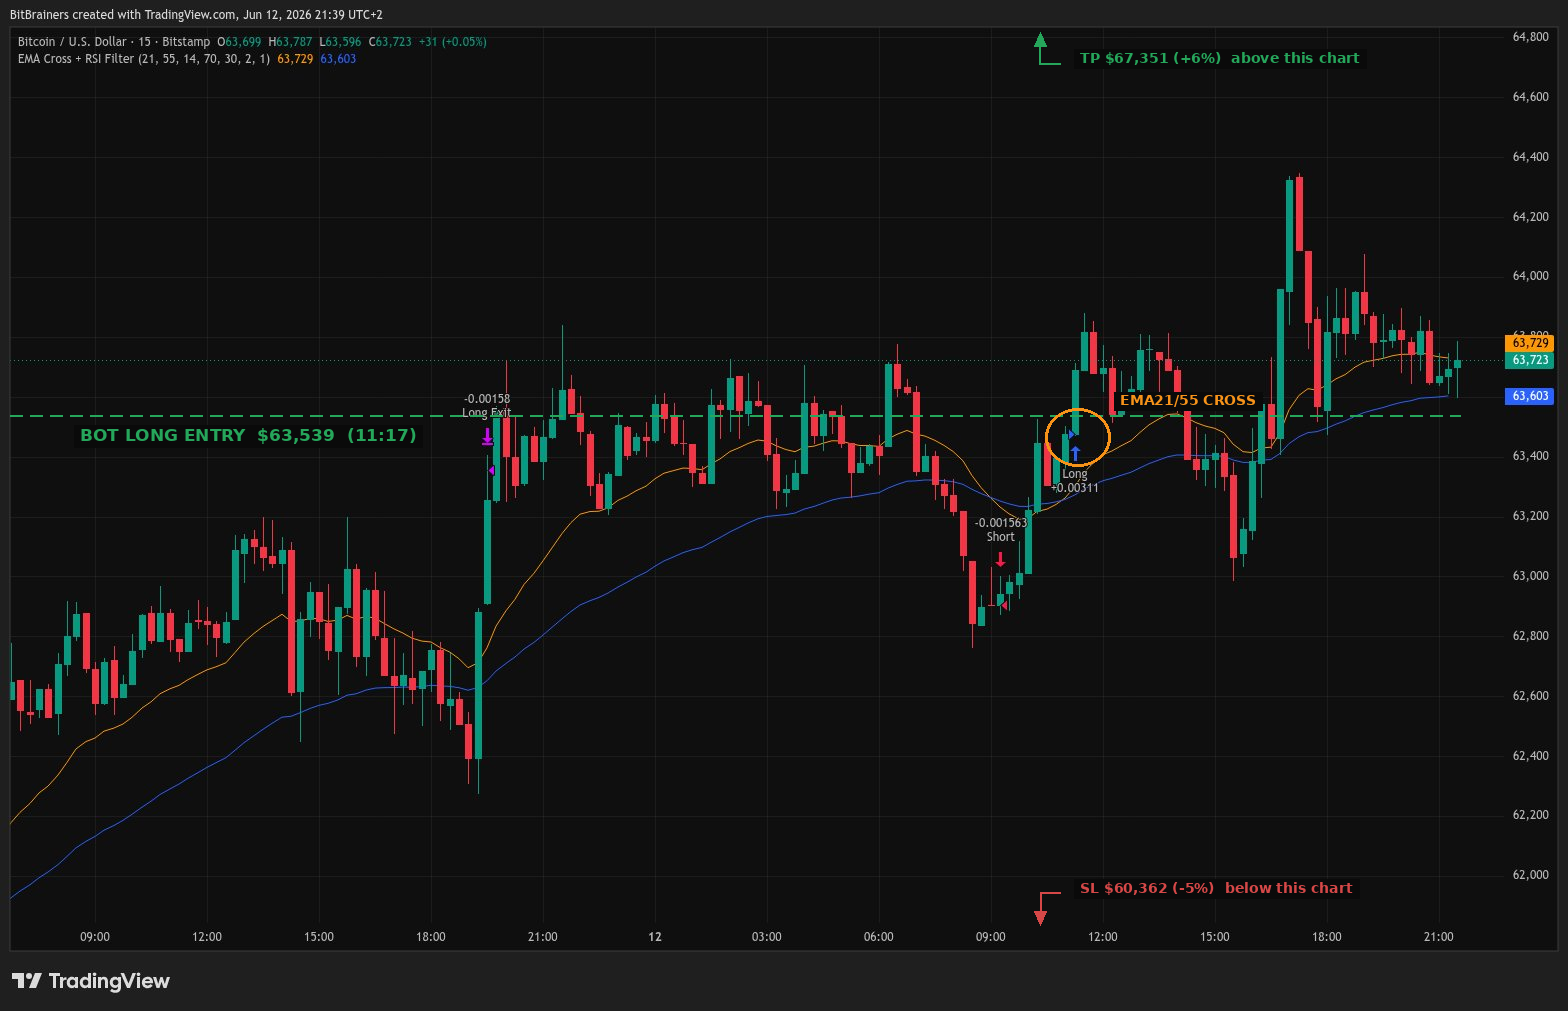
BTC/USD 15m with EMA21 and EMA55. The cross that fired the bot's long entry at $63,539 on June 12. TP and SL sit outside the visible range. Source: TradingView
Read also: The AI Is Not Predicting a Bitcoin Crash. It Is Predicting You.
Wait, Didn't We Just Say the Bottom Isn't In?
We did, this morning, and we're not walking it back. The bottom post argued from the weekly chart: the 14-week RSI sits below the 41.5 line that has separated bull regimes from bear regimes for a decade, and until that reclaims, the macro downtrend is intact. The bot trades the 15-minute chart. It doesn't know what a regime is. It saw sustained buying over a few hours, the fast average crossed the slow one, and the filters passed. That's its entire world.
This is the difference between a position and a trade. The weekly chart answers "should I be accumulating here for the next year." The 15-minute crossover answers "is there a move worth riding for the next day or two." A bear market rally is a real rally on the lower timeframe, and a bot with a defined stop loss is allowed to trade it. A human with no stop and a bag of hope is not. If price rolls over, the bot exits at minus five percent and moves on. That's the whole point of the system.
The Embarrassing Part: The Bot Was Blind for Three Hours
Full transparency, because that's the format: the machine hosting the bot was offline for about three hours today. Not a crash, not a bug, just downtime on the host machine. The strategy didn't fail, the infrastructure did, and a trading bot that depends on a single machine staying awake is not a trading bot, it's a hobby with extra steps.
Nothing fired during the gap as far as we can reconstruct, so this time it cost nothing. But "this time" is doing a lot of work in that sentence. The fix is moving the bot to an always-on machine, and that migration is now on the list. When it happens, we'll write up the setup, costs included, because plenty of readers run bots in exactly this fragile way and nobody ever talks about it.
What We're Watching
The BTC long lives or dies between $60,362 and $67,351. Worth noting where those sit: the stop is just above the $60,000 zone price already tested this week, and the path to take profit runs straight through the $64,000 to $65,000 area that capped the last bounce. If price clears that band and holds, the dry-run trade will likely resolve green. If the bounce fades like the previous ones, the stop does its job. Either outcome is data, and either outcome gets published here.
On The Radar This Week
The timing of these signals is spicy. The BOJ rate decision lands June 15 to 16 with markets expecting a hike to 1.0%, a 31-year high. A stronger yen has historically tightened global liquidity and pressured risk assets, which means both open longs walk straight into a macro event within days. That's not a flaw in the bot, it's a reminder that a 15-minute strategy doesn't read calendars. We do, and next week's report will show whether the stop loss earned its keep.
On the chart, the levels are unchanged: $62,500 below as the support that separates a shakeout from a breakdown, and the weekly RSI line at 41.5 above as the signal that the regime has actually flipped. Until one of those gives way, every long is a rental, not a residence.
Sources
CoinDesk. Live updates: Bitcoin traders eye rally to $75,000, Japan set to hike rate to 31-year high
BitBrainers. We check the facts so you don't have to.
Disclosure: The bot described here runs in dry-run mode for research purposes. No real trades were placed. Nothing in this post is financial advice.
— BitBrainers Editorial


