The Fear & Greed Index is sitting at 8. Not 28. Not 18. Eight. That is not a bad week. That is panic. That is people rage-selling at the bottom, closing longs they should have held, and swearing off crypto until the next bull run reminds them why they came back.
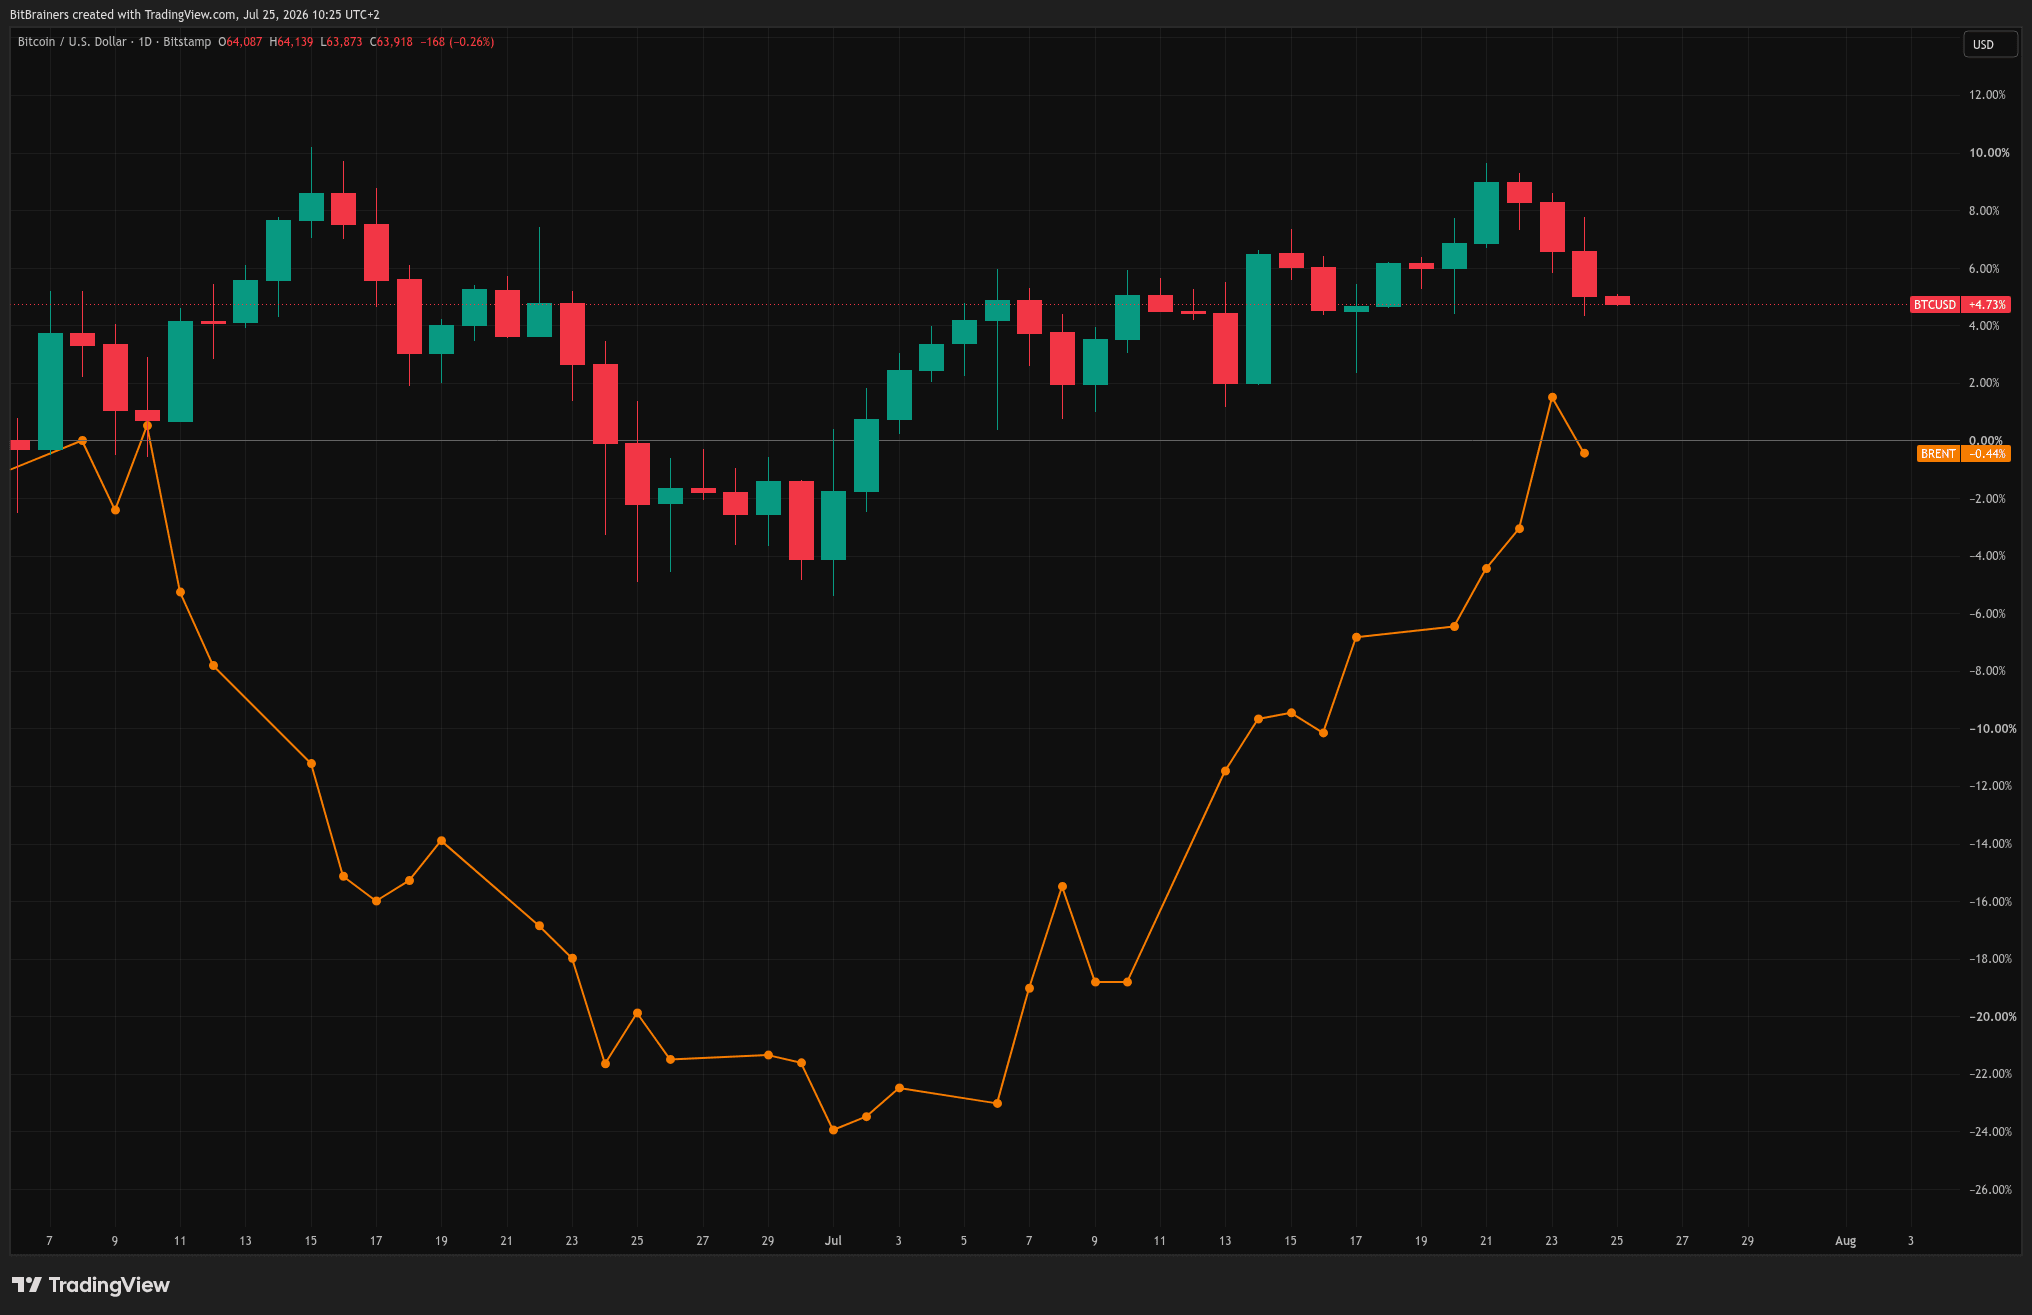
BitBrainers is currently showing a market sentiment score of 8 — Extreme Fear — while Bitcoin trades around $62,500 after a brutal drop from $80K highs in May. The $3.4 billion in ETF outflows, the Fed pushing rate cuts to 2027, the Strategy sell-off, it all hit at once. But here is the thing about Extreme Fear. It has a history. And that history is worth reading before you do anything stupid.
Read also: $390 Billion Gone in a Week and We're Only Getting StartedWhat Is the Fear & Greed Index
It is a 0 to 100 score that measures market sentiment using volatility, momentum, social media, Google trends, and Bitcoin dominance. Zero means everyone is terrified. One hundred means everyone is euphoric and about to get wrecked. The contrarian logic is simple: when everyone is fearful, the smart money is buying. When everyone is greedy, the smart money is selling. Let's look at the receipts.
Read also: Iran Strikes and Korean Markets Crater While Bitcoin Slides Back Under $63KThe Last 3 Extreme Fear Events — At a Glance
| # | Date | Index Low | BTC at Fear | BTC Peak After | Return |
|---|---|---|---|---|---|
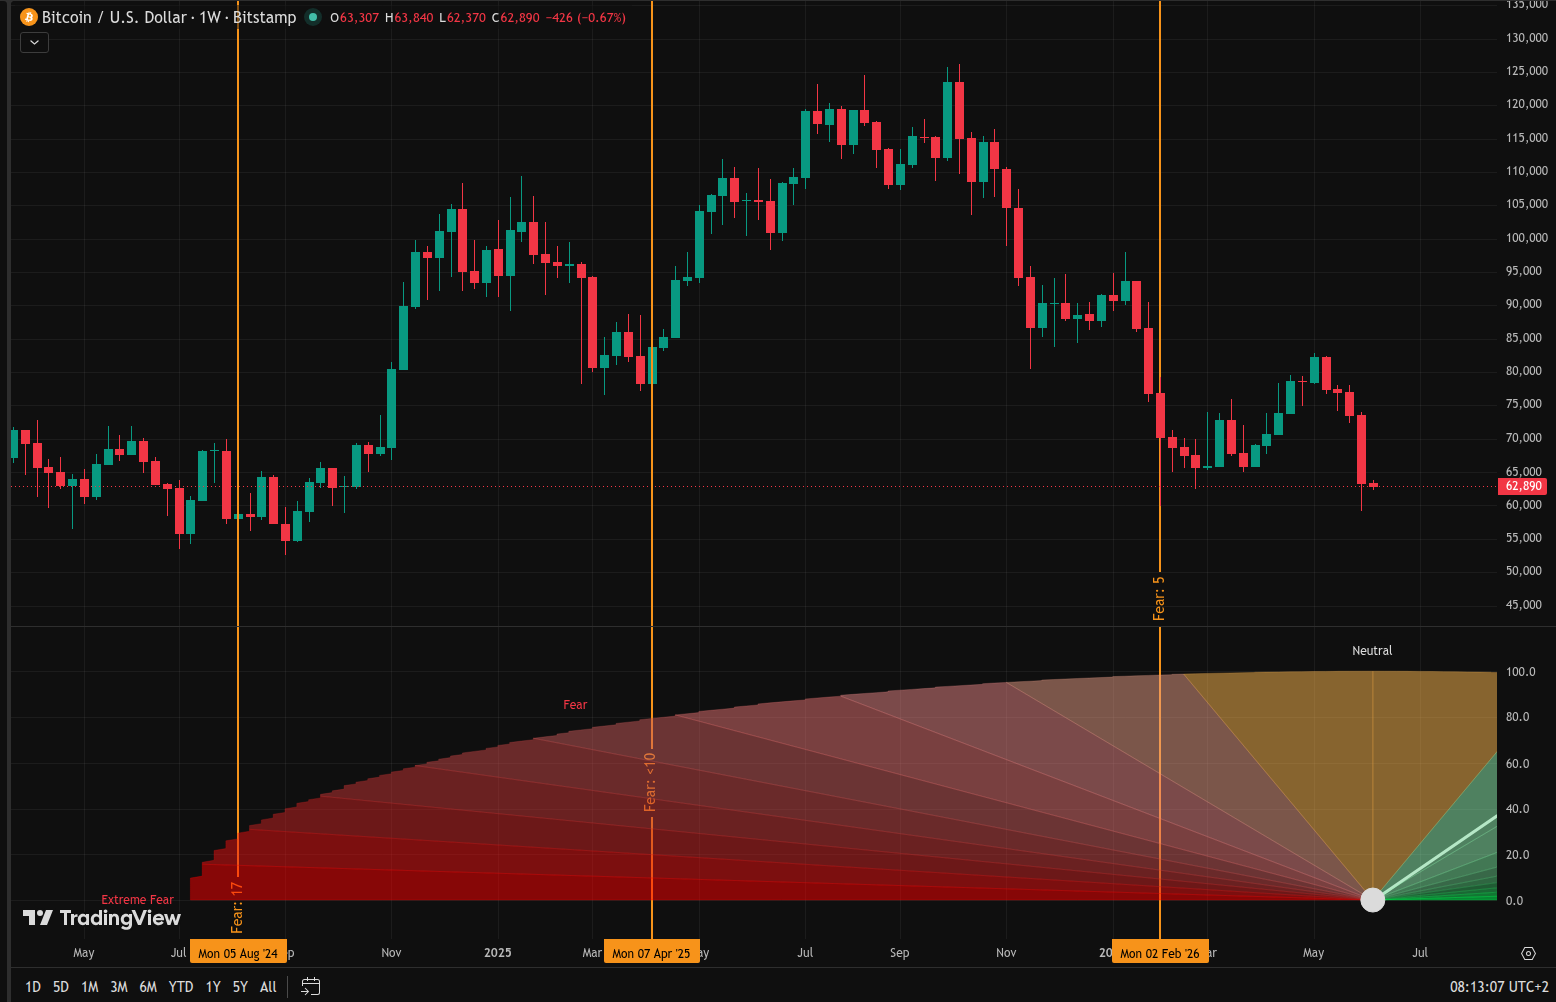
| 1 | August 2024 | ~17 | ~$53,000 | ~$108,000 | +104% |
| 2 | April 2025 | <10 | ~$80,000–$85,000 | New ATH (H2 2025) | +30%+ |
| 3 | February 2026 | 5 (ATL) | ~$60,000 | ~$80,000 (May 2026) | +33% |
| → | June 2026 | 8 | ~$62,500 | ??? | ??? |
Each time the index hit single digits, it marked either the exact bottom or within days of it. Not always immediately. Not predictably. But every single time, significantly.
Case 1: August 2024 — BTC at $53,000, Index ~17
The summer of 2024 was brutal for crypto. Bitcoin had already pulled back sharply from its post-halving euphoria, and by August the market was bleeding. The Fear & Greed Index dropped into Extreme Fear as BTC slid to around $53,000, a level that felt catastrophic after the highs of earlier that year.
The macro backdrop was rough: rate uncertainty was keeping institutional buyers cautious, summer liquidity was thin, and leveraged longs were getting flushed one by one. Retail was exiting. Social media sentiment was at its most negative since the 2022 bear market.
What happened next? Over the following three months, Bitcoin quietly doubled. By November 2024, it crossed $100,000 for the first time in history. The people who sold at $53K in Extreme Fear watched it happen from the sidelines.
The fear was real. The opportunity was realer.
Case 2: April 2025 — Index Below 10, BTC at $80,000–$85,000
This one is the most psychologically interesting case because the price was not even that low. Bitcoin was holding $80,000 to $85,000, well above its previous cycle peaks, yet the Fear & Greed Index collapsed below 10, lower than during the FTX collapse in 2022.
How does that happen? Sentiment can disconnect from price when investors are sitting on large unrealized losses from higher entries, think everyone who bought near $100K in late 2024 and when macroeconomic headlines dominate over fundamentals. The fear was not about where Bitcoin was. It was about where it had been.
That disconnect between price and sentiment is historically one of the most powerful buy signals in crypto. When the index is at 10 and the asset has not collapsed, it usually means the selling is psychological, not structural.
What followed was Bitcoin's push toward new all-time highs in the second half of 2025.
Case 3: February 2026 — Index Hits All-Time Low of 5, BTC at $60,000
This one was historic. On February 6, 2026, the Fear & Greed Index hit 5 — its lowest recorded reading ever. Not just lower than 2024. Lower than the FTX collapse. Lower than the Terra/Luna wipeout. The deepest fear reading in the index's history.
Bitcoin had fallen 52% from its $126,000 peak, bottoming around $60,000. The triggers were layered: macroeconomic pressure, leveraged liquidations exceeding $2.5 billion in a single day, and regulatory uncertainty. The index read 9 the day before, then 5 the next, a two-day freefall in sentiment that marked almost exactly the bottom.
It was not just retail panic. Institutions were reducing exposure too, and on-chain data showed long-term holders beginning to distribute. Everything pointed down. But Bitcoin recovered. By May 2026, it had traded back toward $80,000, a 33% gain from the fear bottom. The index of 5 was the floor, not the beginning of a new leg down.
So What About Now? June 2026 — Index at 8
Index at 8. Bitcoin at $62,500. ETF outflows at $3.4 billion for the week, a record. The Fed is pushing rate cuts to 2027. Strategy sold BTC. Everyone is scared.
The pattern across all three previous cases is consistent: Extreme Fear readings cluster near bottoms, not midpoints. They mark the moment when the last weak hands have sold and the market is priced for maximum pessimism. Historically, Bitcoin does not stay in single-digit fear territory for long — and it has never failed to recover substantially from it.
That does not mean the bottom is in today. The $60,000 level is the next key technical support. If it breaks, sentiment could get worse before it gets better. But every Extreme Fear reading in the last two years has eventually resolved upward, significantly. The institutions still have $100,000 to $170,000 year-end targets. The ETF infrastructure is intact. The halving supply math has not changed.
The fear is the setup. Whether you act on it is up to you.
On The Radar This Week
Bitcoin is sitting at the $62,500 level that separates a rough week from a structural problem. ETF outflows hit $3.4 billion in a single week, the largest since the ETF launch in 2024 which tells you institutional hands are not buying this dip with conviction. The Bank of Japan decision on June 15 to 16 is the macro event that could accelerate everything. Markets are pricing a rate hike to 1.0%, and a confirmed move tightens the yen carry trade, which historically pulls liquidity out of risk assets fast. Watch USD/JPY movement the evening of June 14 Belgrade time for the early signal. On the regulatory side, the CLARITY Act is moving toward a Senate vote this summer and will directly affect how exchanges and token issuers operate in the US. Both threads will define where serious capital flows in the second half of 2026.
BitBrainers. We check the facts so you don't have to.
Disclosure: This post contains affiliate links to Trezor and Kraken. BitBrainers may earn a commission at no extra cost to you. This is not financial advice.
— BitBrainers Editorial