By BitBrainers Editorial
Ranges This Long Only Form in One Kind of Market
Both bands ahead of it on the list were bear market bottoms: 2018's $10-20K and 2022's $20-30K. Heavily traded ranges form where sellers have exhausted their urgency but buyers see no reason to chase, and the two sides grind against each other for months at a time.
That grind leaves a mark on the chain. Glassnode's cost-basis data shows roughly 6% of the entire circulating supply last changed hands between $58,000 and $64,000, the largest cluster of cost-basis levels in Bitcoin's history. Six percent of all Bitcoin now has its break-even point directly underneath the current price.
That cluster cuts both ways. It acts as support while holders defend their entry, and it becomes a wall of sellers eager to exit at break-even if price dips below it and later recovers. Worth saying plainly: the cluster's existence is also the bull case in miniature. Six percent of supply changing hands here means someone spent ten months buying everything that was sold, and that absorption is demand, not just risk.
The Line Running Through the Middle
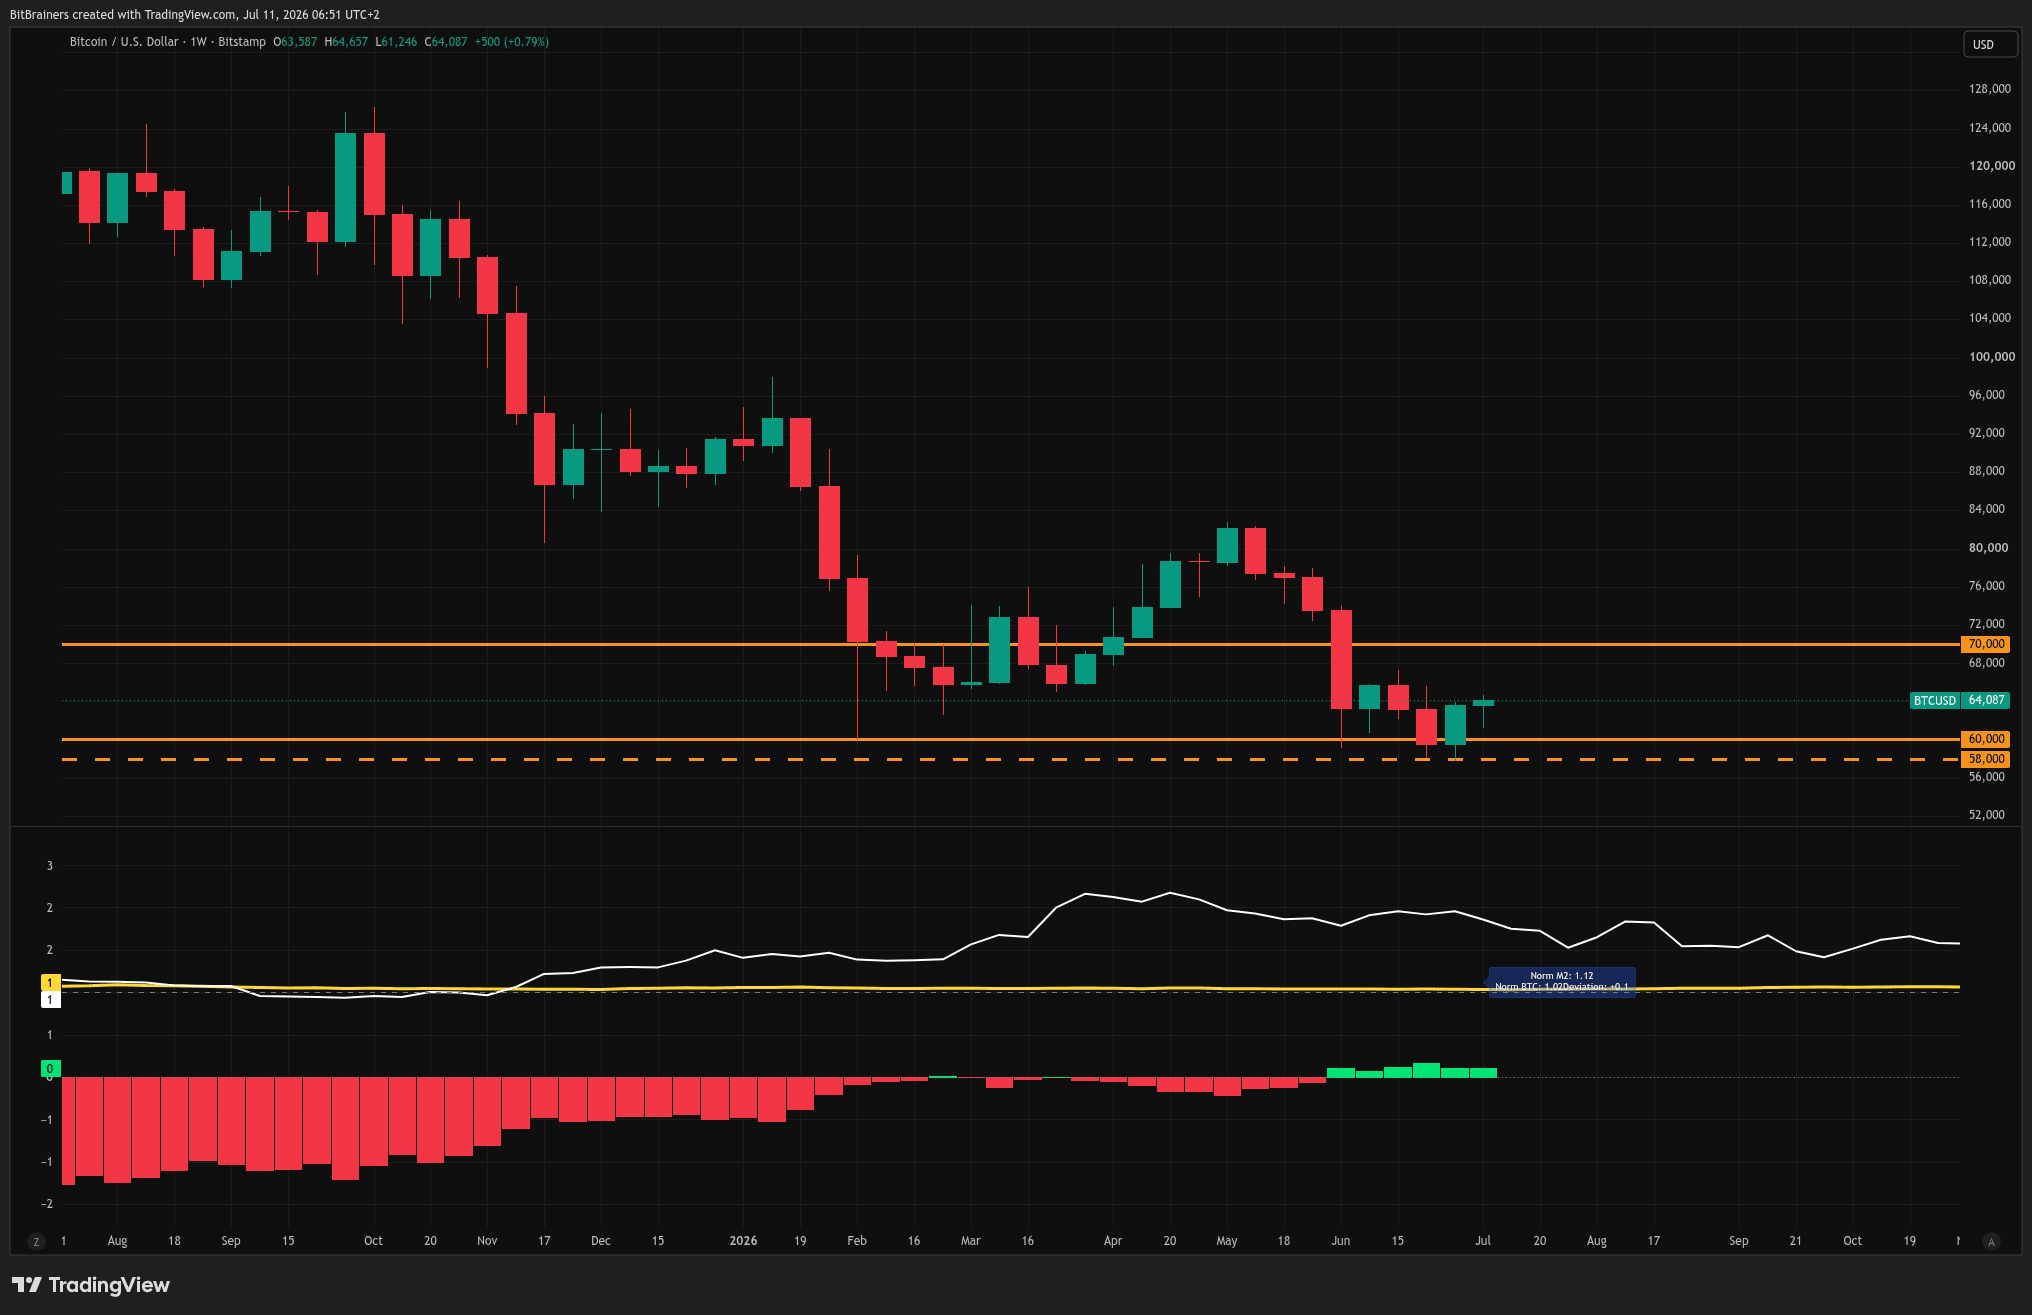
The 200-week moving average sits near $62,873, almost exactly mid-range. Every major Bitcoin bear market has eventually found its floor around this line, and the few times price broke below it, the stay was brief.
So the range isn't random. Price keeps returning to and oscillating around the single most historically reliable long-term support in the asset's history, while half the market calls it a crash and the other half calls it a bottom.
Why This Range Isn't Quite Like the Other Two
There's a structural difference the record-chasing coverage skips. The 2018 and 2022 consolidations both formed after drawdowns of roughly 80% from the prior peak, at levels where nearly everyone who wanted out was already gone.
This range sits only about 50% below the October 2025 high of $126,198. The 2018 and 2022 ranges were exhaustion. This one is happening with far more of the market still holding positions from higher prices, which means far more potential supply overhead if price starts moving up.
CryptoQuant's Ki Young Ju put a related number on it this week: in 2011, $2.7 billion of inflows moved Bitcoin over 55,000%. Each cycle since has needed vastly more money for smaller gains. A $1.28 trillion asset doesn't get pushed out of a range by enthusiasm. It gets pushed out by flows, which is why the ETF numbers matter more than the pattern.
The most familiar range in Bitcoin. One email when it breaks.
We track the levels that matter, not the noise between them.
SubscribeWhat the Market Is Actually Pricing
Prediction markets put numbers on the boredom. Polymarket traders give an 83% chance Bitcoin touches $65,000 at some point in July, but only 27% for $70,000, and a 46% chance of sliding back to $60,000 first.
Translated: the market expects the range to hold. High odds of tagging the nearby level, low odds of actually escaping the band, and nearly a coin flip on revisiting the bottom of it. The Fear & Greed index at 27 says sentiment agrees.
ETF flows tell the same undecided story. Thursday's $221.7 million inflow snapped a ten-day outflow streak, then Friday's $95 million outflow snapped the snap. Institutional money is doing exactly what price is doing: nothing, loudly.
The Part the Record Doesn't Tell You
Here is the honest limit of this statistic. The two longer consolidations resolved upward into new bull markets, which makes the pattern tempting to extrapolate. But two prior cases is not a base rate, it's a pair of anecdotes.
One honest note on the statistic itself: most coverage is reporting the 307 days as one continuous trap, and a glance at a weekly chart shows that's wrong, since price was above $100K as recently as November. It's cumulative time across visits. We made the broader argument about patterns and their marketing yesterday in Three Models Walk Into 2026, and it applies to this range too. History says long ranges near the 200-week average have resolved up. History also had a sample size that fits on one hand.
What has a mechanism rather than a pattern is liquidity. Our M2 deviation indicator flipped positive in June and has held there since, meaning global money supply is running ahead of Bitcoin's price while the range grinds on. If that deviation persists and the range still refuses to break upward by autumn, that tells you something real about how much the liquidity relationship has weakened.
The Levels That End This
Ranges this heavily traded don't resolve quietly. Below, the cost-basis cluster starts at $58,000, and losing it puts 6% of supply underwater at once. Above, $67,250 is the June high inside the band, and $70,000 is the ceiling that has held for ten months.
Until one of those gives way, every rally is a trade inside a box, and every dip is too. The cumulative count keeps climbing every week price stays here, and at this pace the band takes the number two spot from 2022 before the year is out. Whether that ends up being a bottom statistic or just a long pause depends entirely on which wall breaks first.
Sources:
CoinDesk: Bitcoin's $60,000-$70,000 range becomes third most traded range in history
TipRanks: Bitcoin's Price Is Trapped Right Now as One of History's Longest 307-Day Slumps Continues
Benzinga (via Yahoo Finance): Bitcoin Has Not Left the $60,000-$70,000 Range in 307 Days: What Is Happening?
This is market commentary, not financial advice. Nothing here is a recommendation to buy or sell any asset. Do your own research.