By BitBrainers Editorial
Verdict One: You Are in the Frozen Zone
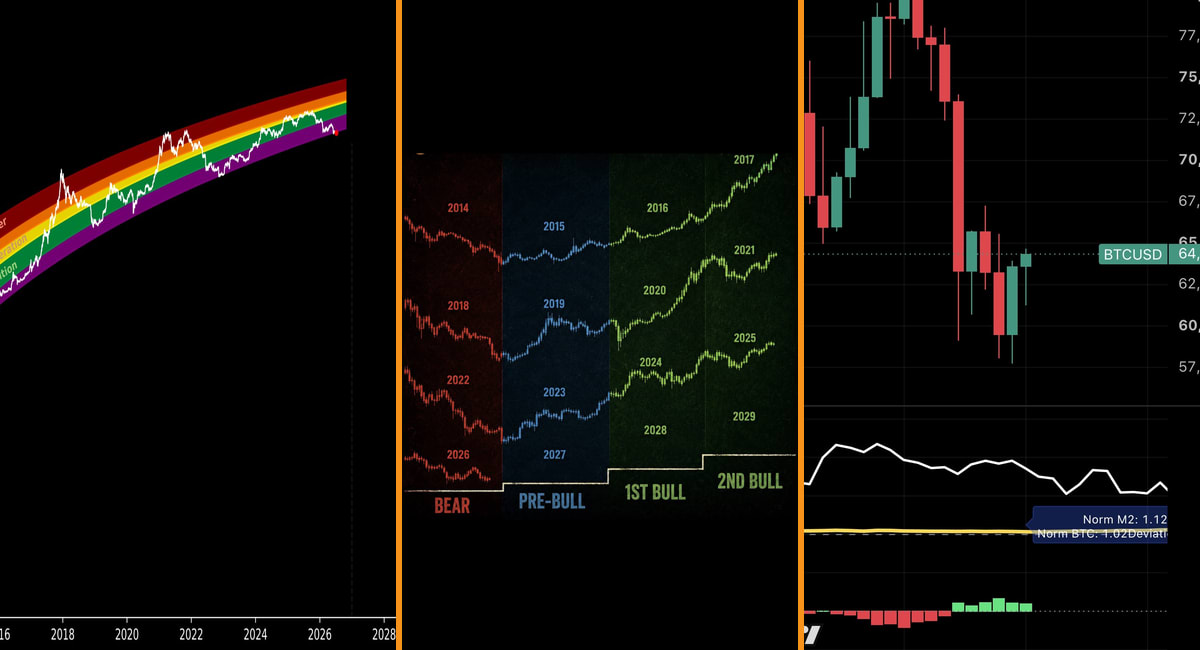
The quantile model fits Bitcoin's entire price history into percentile bands along a logarithmic growth curve. On that curve, the low $60,000s sit near the 1st percentile, deep in the band the model labels "frozen." Historically, time spent down there marked accumulation phases: late 2015, the 2018 winter, the 2022 lows. The model's current readout puts fair value bands at $122K for the 33rd percentile and $354K for the 99th.
Its weakness is the thing that makes it look precise. The bands are a curve fitted to one asset's past, and this family of models has a habit of being quietly redrawn each time price escapes it. The original rainbow chart was recalibrated after 2021. Stock-to-flow was abandoned by most of its followers after 2022. A "risk score of 1%" means price is at an extreme of its own fitted history. It says nothing about the probability of going lower.
Verdict Two: This Year Was Cancelled in Advance
The four-year cycle template stacks Bitcoin's history into repeating columns: bear year, pre-bull year, two bull years. In that grid, 2026 lands in the red column with 2014, 2018 and 2022, and 2027 is scheduled as the recovery. Some versions of this chart go further and draw the 2026 candles as already falling, pasting the template forward in the same visual style as real data. A prediction, dressed as a pattern.
The sample size is three completed cycles. Three. Any pattern that has occurred three times can be a mechanism or a coincidence, and the only way to tell is to ask what drove it. The historical driver was a halving supply shock hitting a market dominated by retail flow. That is precisely the structure that has been dismantled over the past two years.
Verdict Three: Liquidity Already Turned
The third framework isn't a price pattern at all. Global M2 money supply, normalized against Bitcoin and lagged, has led major price moves with a delay that nobody agrees on but most estimates put between 70 and 110 days. On our chart, the M2 deviation flipped positive in June and has held there for six weeks: normalized M2 at 1.12 against normalized BTC at 1.02. Liquidity is running ahead of price.
We covered the mechanism and its unreliable lag in detail in Bitcoin Follows M2 With a Lag. Nobody Agrees on How Long. The short version: this one at least has a causal story. More dollars in the system eventually chase scarce assets. That is an economic mechanism, not a calendar superstition. It can still fail, but it fails for reasons you can examine, not because a four-year clock struck the wrong hour.
What 2026 Did to All Three
The year opened near $93,000. Under the cycle template, that number should not exist, a bear year is supposed to grind lower from the start, not open near highs. Then the Fed held, ETFs bled a record $4.5 billion in June, and price broke to a 21-month low near $58,200. Now the quantile model calls this level frozen and historically cheap, while the same June that crushed price is when the M2 deviation turned positive.
So the scorecard reads: the cycle template was wrong about January, the quantile model has been "cheap" since the mid $70,000s and bleeding the whole way down, and the liquidity signal is currently making a claim that won't be testable until autumn. Anyone telling you one of these frameworks called this year is grading on a curve.
The Participants Left, Not the Pattern
Here is the structural point underneath the chart drama. The cycle pattern was built on a specific market: halvings cutting new supply while demand came mostly from individuals reacting to price itself. That reflexive loop produced the boom-bust rhythm the templates memorized.
Today's marginal flow looks nothing like that. Spot ETFs move billions on allocation decisions made quarterly by committees. Corporate treasuries buy and sell against dividend schedules and debt covenants, as Strategy's new monetization framework just demonstrated. Miners increasingly earn from AI compute contracts that don't care what block rewards do. None of these participants know or care what year of the "cycle" it is. The pattern didn't break so much as its cast quit the show.
How to Actually Use This
A model earns attention in proportion to its mechanism, not its track record on three data points. The quantile bands are a useful way to see where price sits relative to its own history, nothing more. The four-year calendar deserves retirement honors and a quiet exit. The liquidity framework is the only one of the three making a falsifiable claim right now: if the positive M2 deviation persists and price hasn't followed within roughly a quarter, that model takes real damage too.
Our position hasn't changed since the M2 post. Watch the mechanism, hold it to a deadline, and treat every chart that fits the past perfectly as a description wearing a prediction costume. Three cycles is not a sample. It's an anecdote with better graphics.
This is market commentary, not financial advice. Nothing here is a recommendation to buy or sell any asset. Do your own research.