
₿ BTC Loading... via Binance

Sunday, July 12, 2026

The Ethereum Foundation Found a Real Bug. The Stat Everyone's Citing Isn't Theirs.

BitBrainers - The Ethereum Foundation Found a Real Bug

By BitBrainers Editorial

On July 9, the Ethereum Foundation's Protocol Security team published a report on an experiment: pointing coordinated AI agents at the code Ethereum's validators actually run. The agents found a real bug. It's the second part of that story that's more interesting than the bug itself.

What The Agents Actually Caught

The bug lives in libp2p's gossipsub, the peer-to-peer messaging layer Ethereum consensus clients use to talk to each other. Send one specially built message and a validator node crashes outright. No special access needed, no authentication, just a peer connection and the right payload.

It's now public as CVE-2026-34219, patched and credited to the Foundation's own team, fixed in libp2p-gossipsub v0.49.4. The flaw lived specifically in the Rust implementation, so clients built on a different language stack weren't exposed to this exact bug. That's Ethereum's client diversity doing its job: a language-specific flaw in one implementation doesn't automatically compromise every validator on the network.

Nikos Baxevanis, who wrote up the experiment, said finding the bug wasn't actually the surprising part.

The Part That Actually Surprised Them

In the team's own words, "the surprise was how little of the work went into finding them." Not the discovery. What came after it: telling the real bugs apart from ones that just looked real.

The team runs several agents in parallel against one codebase, each with a role. Recon turns a section of code into a specific, testable claim instead of a vague audit target. Hunting takes one hypothesis and tries to build something that actually reproduces the failure.

Gap-filling looks at what already got rejected and writes the next round of hypotheses, so the agents stop circling the same ground. Validation checks every surviving candidate independently and throws out duplicates. One rule overrides all four roles: nothing counts as a finding until it reproduces against the real, shipped code.

Three Ways The Agents Fooled Themselves

Most of what the agents flagged wasn't real, and the team was specific about how the false positives kept happening. The first is a panic that only shows up in a debug build, where extra safety checks exist that the shipped software never carries. Run it the way the code actually ships, and nothing breaks.

The second is a reproducer built on a value no real attacker could ever deliver, because every path an outside user actually controls rejects that value before it gets near the vulnerable code. The bug is real only against a function nothing reachable calls that way.

The third shows up in formal verification, where a mathematical proof technically passes but proves something trivial, or a weaker claim than the one that actually mattered. The proof is satisfied without ever constraining the behavior it was supposed to guarantee.

Most Crypto News Skips The Verification Step. We Don't.

One weekly email. The claims we checked, the ones that didn't hold up, and why.

Subscribe

The Number That Isn't Theirs

Here's where it gets interesting for anyone reading crypto press this week. The Foundation explicitly declined to publish its own acceptance rate. Baxevanis wrote that a number tied to one specific target would say more about that target than about the method, so he left it out.

The 86 percent figure now circulating across crypto outlets as if it's Ethereum's success rate actually belongs to Anthropic. It comes from a separate experiment, a property-based-testing agent run across the Python ecosystem, generating roughly a thousand candidate reports before ranking and expert review got the top tier down to that number. The Foundation cited it as a comparison point from another team's work, not as its own result.

That distinction matters more than it looks. One is Ethereum publishing an audited number about validator-critical code. The other is a stat about unrelated Python libraries getting repeated as if the Foundation said it about itself. Same instinct that makes us check a quote against its original source before it goes out here.

This Isn't The First Time

AI-assisted audits already have one real scalp this year. In May, security researcher Taylor Hornby used Anthropic's Claude Opus 4.8 in an audit that found a critical flaw in Zcash's Orchard privacy pool, a bug that had existed for roughly four years and could have let someone mint counterfeit ZEC without leaving an obvious trace on-chain. Zcash patched the immediate hole in a June 3 hard fork, but the deeper problem, no way to prove nothing was ever minted, needed a separate fix. That's Ironwood, formally NU6.3, set to activate July 28 and seal the old pool behind a checkpoint that would expose any counterfeit coins trying to move.

Cloudflare ran a frontier model against its own infrastructure with a similar setup and landed on the same conclusion the Ethereum team did: a narrow, well-scoped target beats scanning everything at once. Three different teams, three different codebases, and they converged on the same bottleneck without comparing notes first.

What Actually Changes From Here

The Foundation says disclosure practices are getting their own follow-up post, worth watching given how much of this space still runs on informal norms. It's also funding a dedicated grant round through its Ecosystem Support Program specifically for AI-assisted protocol security work, so this experiment is becoming a program, not a one-off.

The more immediate thing worth tracking is how fast client teams actually patch. A fixed vulnerability sitting in a GitHub advisory doesn't protect a validator that hasn't updated yet, and gossipsub touches every consensus client on the network. The bug getting fixed is only half the story. Patch adoption speed across the validator set is the other half, and it's the part that doesn't come with a press release.


Sources:
Ethereum Foundation Blog, The triage is the product: running AI agents against Ethereum's protocol code
Decrypt, Ethereum Foundation Turns AI Loose on ETH Network to Find Bugs Before Hackers Do
CoinDesk, AI found an Ethereum bug that could take validators offline, but humans had to prove it

This is market commentary, not financial advice. BitBrainers holds Bitcoin and other digital assets. Nothing here is a recommendation to buy or sell any asset. Do your own research.

Saturday, July 11, 2026

307 Days on One Shelf. Bitcoin Keeps Coming Back to the Same $10,000 Band.

BitBrainers - 307 Days on One Shelf. Bitcoin Keeps Coming Back to the Same $10,000 Band.

By BitBrainers Editorial

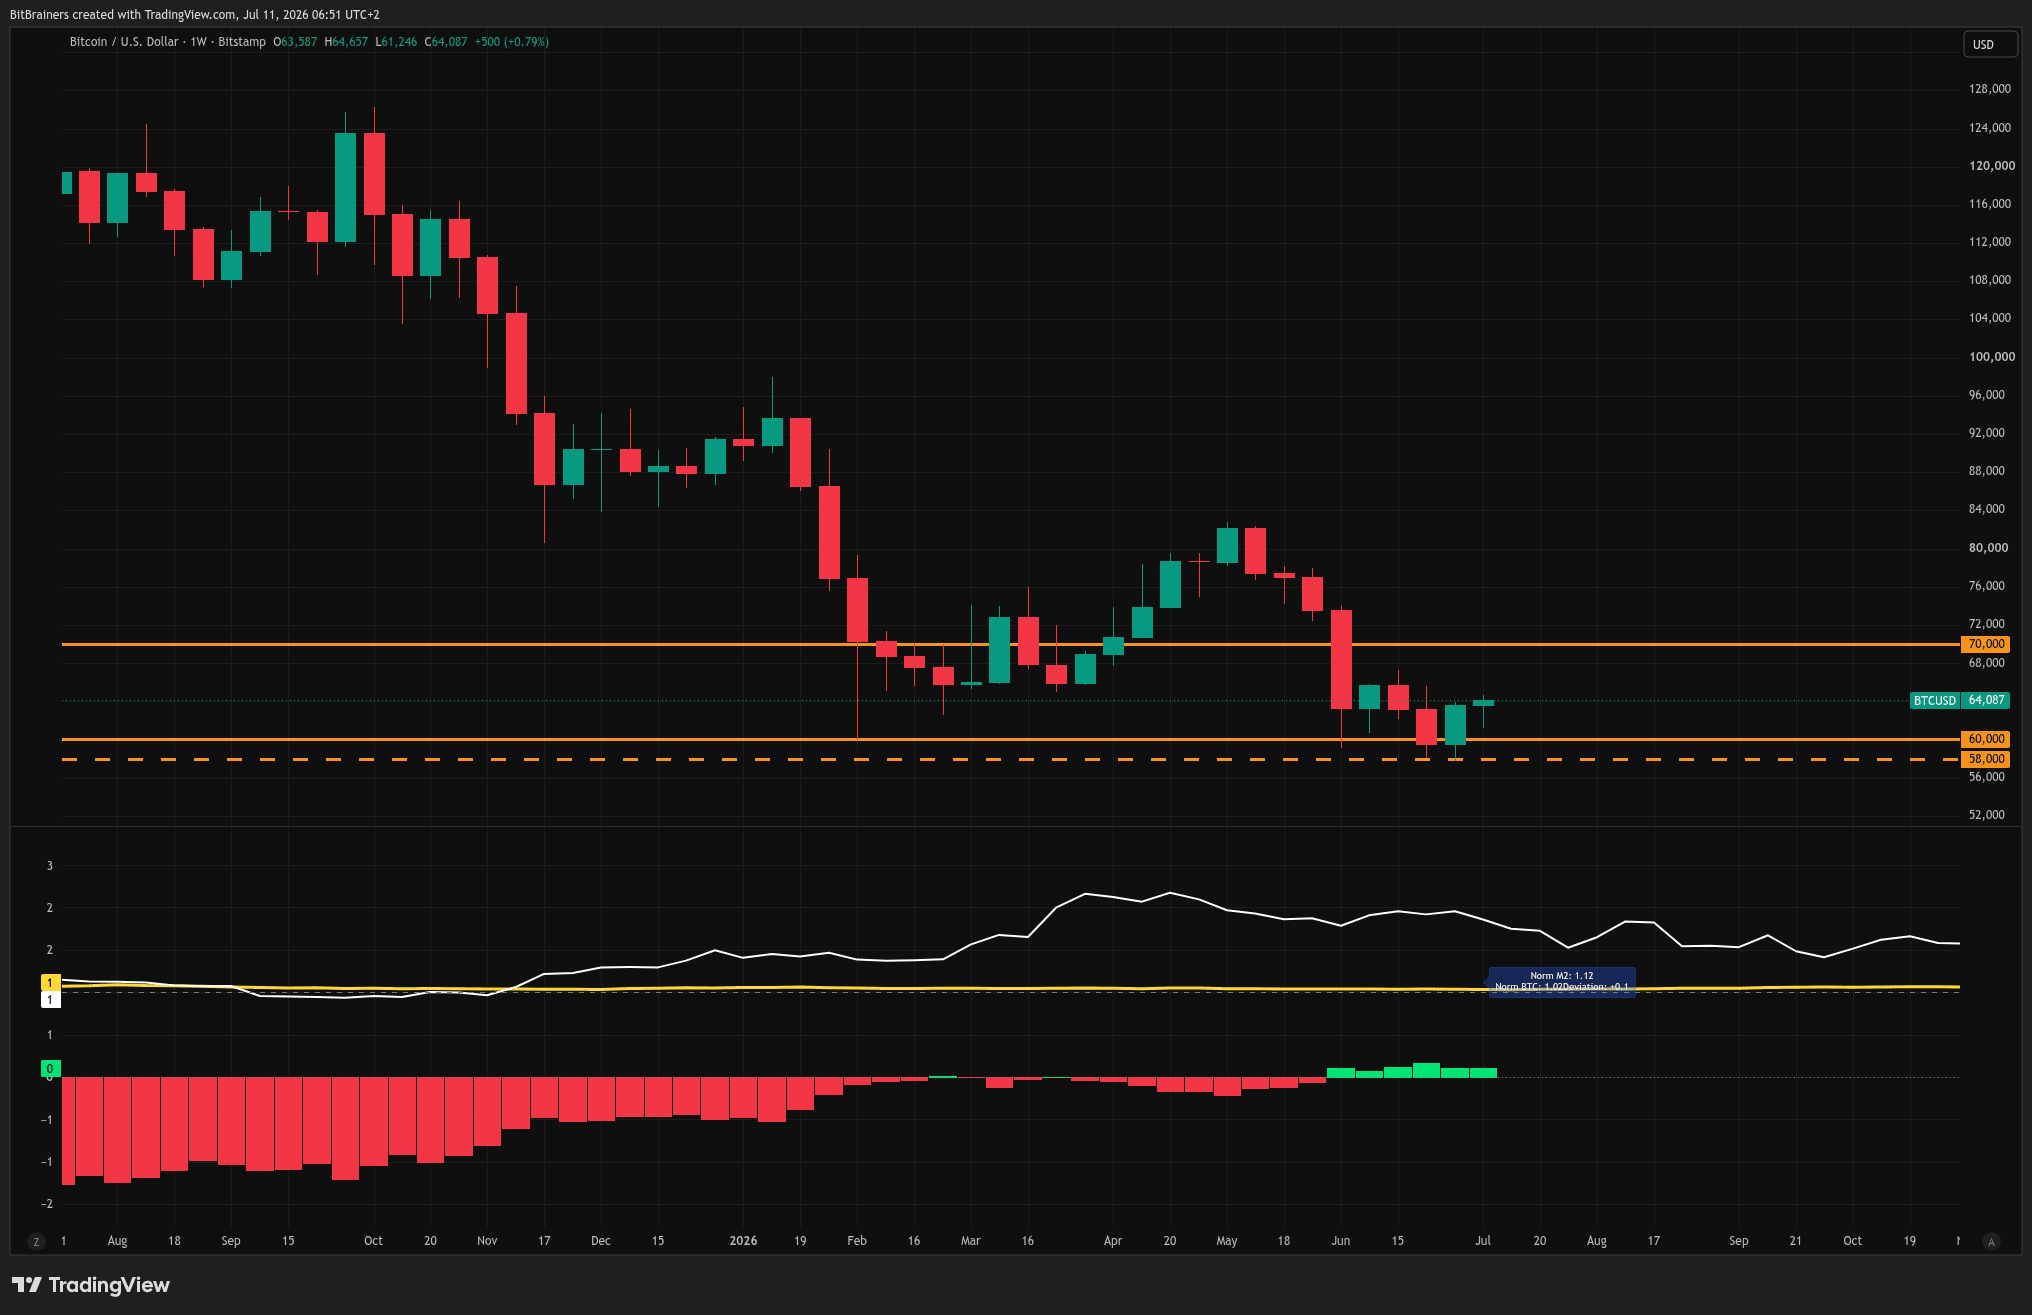
Bitcoin has now spent a cumulative 307 days inside the $60,000 to $70,000 band, per Glassnode, making it the third most traded $10,000 range in the asset's history. That count includes most of 2024, when price lived here for months before the run to $126K, plus the current stretch that began this winter. The only two longer ones were the 2018 bear market between $10,000 and $20,000, and the 2022 bear market between $20,000 and $30,000. The company this range keeps tells you what kind of market this is.

Ranges This Long Only Form in One Kind of Market

Both bands ahead of it on the list were bear market bottoms: 2018's $10-20K and 2022's $20-30K. Heavily traded ranges form where sellers have exhausted their urgency but buyers see no reason to chase, and the two sides grind against each other for months at a time.

That grind leaves a mark on the chain. Glassnode's cost-basis data shows roughly 6% of the entire circulating supply last changed hands between $58,000 and $64,000, the largest cluster of cost-basis levels in Bitcoin's history. Six percent of all Bitcoin now has its break-even point directly underneath the current price.

That cluster cuts both ways. It acts as support while holders defend their entry, and it becomes a wall of sellers eager to exit at break-even if price dips below it and later recovers. Worth saying plainly: the cluster's existence is also the bull case in miniature. Six percent of supply changing hands here means someone spent ten months buying everything that was sold, and that absorption is demand, not just risk.

BTCUSD weekly chart with the 60-70K band and 58K cost-basis floor marked

The Line Running Through the Middle

The 200-week moving average sits near $62,873, almost exactly mid-range. Every major Bitcoin bear market has eventually found its floor around this line, and the few times price broke below it, the stay was brief.

So the range isn't random. Price keeps returning to and oscillating around the single most historically reliable long-term support in the asset's history, while half the market calls it a crash and the other half calls it a bottom.

Why This Range Isn't Quite Like the Other Two

There's a structural difference the record-chasing coverage skips. The 2018 and 2022 consolidations both formed after drawdowns of roughly 80% from the prior peak, at levels where nearly everyone who wanted out was already gone.

This range sits only about 50% below the October 2025 high of $126,198. The 2018 and 2022 ranges were exhaustion. This one is happening with far more of the market still holding positions from higher prices, which means far more potential supply overhead if price starts moving up.

CryptoQuant's Ki Young Ju put a related number on it this week: in 2011, $2.7 billion of inflows moved Bitcoin over 55,000%. Each cycle since has needed vastly more money for smaller gains. A $1.28 trillion asset doesn't get pushed out of a range by enthusiasm. It gets pushed out by flows, which is why the ETF numbers matter more than the pattern.

The most familiar range in Bitcoin. One email when it breaks.

We track the levels that matter, not the noise between them.

Subscribe

What the Market Is Actually Pricing

Prediction markets put numbers on the boredom. Polymarket traders give an 83% chance Bitcoin touches $65,000 at some point in July, but only 27% for $70,000, and a 46% chance of sliding back to $60,000 first.

Translated: the market expects the range to hold. High odds of tagging the nearby level, low odds of actually escaping the band, and nearly a coin flip on revisiting the bottom of it. The Fear & Greed index at 27 says sentiment agrees.

ETF flows tell the same undecided story. Thursday's $221.7 million inflow snapped a ten-day outflow streak, then Friday's $95 million outflow snapped the snap. Institutional money is doing exactly what price is doing: nothing, loudly.

The Part the Record Doesn't Tell You

Here is the honest limit of this statistic. The two longer consolidations resolved upward into new bull markets, which makes the pattern tempting to extrapolate. But two prior cases is not a base rate, it's a pair of anecdotes.

One honest note on the statistic itself: most coverage is reporting the 307 days as one continuous trap, and a glance at a weekly chart shows that's wrong, since price was above $100K as recently as November. It's cumulative time across visits. We made the broader argument about patterns and their marketing yesterday in Three Models Walk Into 2026, and it applies to this range too. History says long ranges near the 200-week average have resolved up. History also had a sample size that fits on one hand.

What has a mechanism rather than a pattern is liquidity. Our M2 deviation indicator flipped positive in June and has held there since, meaning global money supply is running ahead of Bitcoin's price while the range grinds on. If that deviation persists and the range still refuses to break upward by autumn, that tells you something real about how much the liquidity relationship has weakened.


The Levels That End This

Ranges this heavily traded don't resolve quietly. Below, the cost-basis cluster starts at $58,000, and losing it puts 6% of supply underwater at once. Above, $67,250 is the June high inside the band, and $70,000 is the ceiling that has held for ten months.

Until one of those gives way, every rally is a trade inside a box, and every dip is too. The cumulative count keeps climbing every week price stays here, and at this pace the band takes the number two spot from 2022 before the year is out. Whether that ends up being a bottom statistic or just a long pause depends entirely on which wall breaks first.

Sources:
CoinDesk: Bitcoin's $60,000-$70,000 range becomes third most traded range in history
TipRanks: Bitcoin's Price Is Trapped Right Now as One of History's Longest 307-Day Slumps Continues
Benzinga (via Yahoo Finance): Bitcoin Has Not Left the $60,000-$70,000 Range in 307 Days: What Is Happening?

This is market commentary, not financial advice. BitBrainers holds Bitcoin and other digital assets. Nothing here is a recommendation to buy or sell any asset. Do your own research.
Friday, July 10, 2026

Three Models Walk Into 2026. None of Them Survive Contact.

BitBrainers - Three Models Walk Into 2026. None of Them Survive Contact.

By BitBrainers Editorial

Right now, three popular frameworks are all looking at the same Bitcoin price near $64,500 and reaching three different verdicts. One says it's historically cheap. One says this whole year is a write-off. One says liquidity has already turned and price just hasn't noticed. They cannot all be load-bearing at the same time, and this year has been quietly stress-testing all three.

Verdict One: You Are in the Frozen Zone

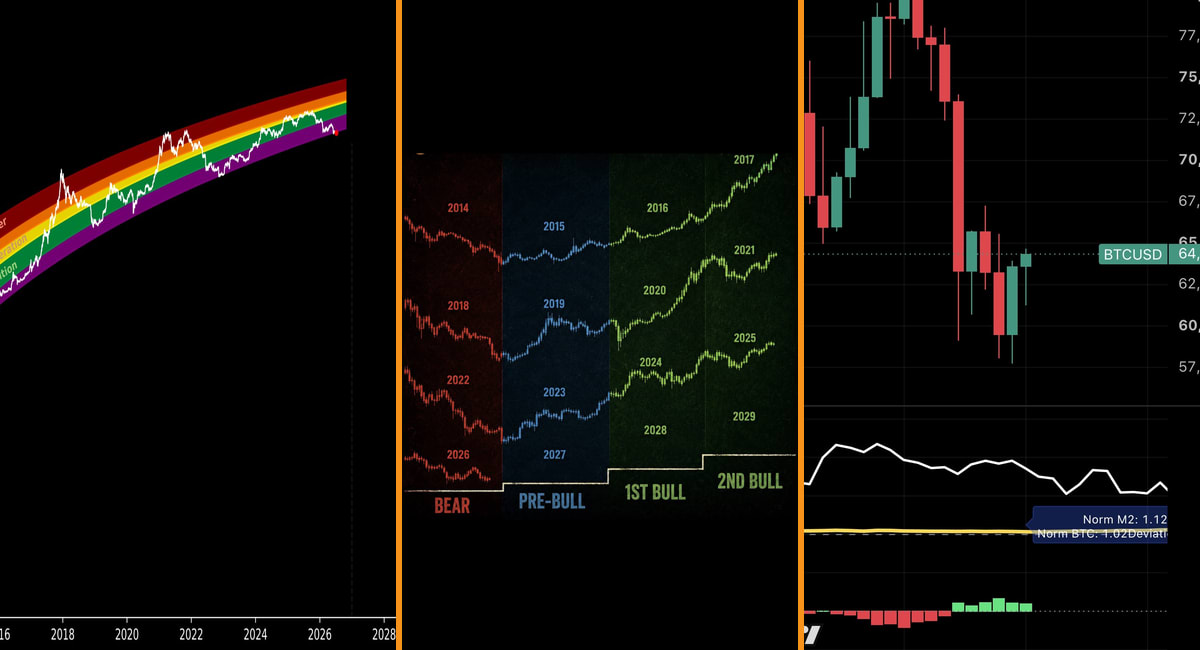
The quantile model fits Bitcoin's entire price history into percentile bands along a logarithmic growth curve. On that curve, the low $60,000s sit near the 1st percentile, deep in the band the model labels "frozen." Historically, time spent down there marked accumulation phases: late 2015, the 2018 winter, the 2022 lows. The model's current readout puts fair value bands at $122K for the 33rd percentile and $354K for the 99th.

Its weakness is the thing that makes it look precise. The bands are a curve fitted to one asset's past, and this family of models has a habit of being quietly redrawn each time price escapes it. The original rainbow chart was recalibrated after 2021. Stock-to-flow was abandoned by most of its followers after 2022. A "risk score of 1%" means price is at an extreme of its own fitted history. It says nothing about the probability of going lower.

Verdict Two: This Year Was Cancelled in Advance

The four-year cycle template stacks Bitcoin's history into repeating columns: bear year, pre-bull year, two bull years. In that grid, 2026 lands in the red column with 2014, 2018 and 2022, and 2027 is scheduled as the recovery. Some versions of this chart go further and draw the 2026 candles as already falling, pasting the template forward in the same visual style as real data. A prediction, dressed as a pattern.

The sample size is three completed cycles. Three. Any pattern that has occurred three times can be a mechanism or a coincidence, and the only way to tell is to ask what drove it. The historical driver was a halving supply shock hitting a market dominated by retail flow. That is precisely the structure that has been dismantled over the past two years.

Models age. Mechanisms don't.

One email when something actually changes. No daily noise.

Subscribe

Verdict Three: Liquidity Already Turned

The third framework isn't a price pattern at all. Global M2 money supply, normalized against Bitcoin and lagged, has led major price moves with a delay that nobody agrees on but most estimates put between 70 and 110 days. On our chart, the M2 deviation flipped positive in June and has held there for six weeks: normalized M2 at 1.12 against normalized BTC at 1.02. Liquidity is running ahead of price.

We covered the mechanism and its unreliable lag in detail in Bitcoin Follows M2 With a Lag. Nobody Agrees on How Long. The short version: this one at least has a causal story. More dollars in the system eventually chase scarce assets. That is an economic mechanism, not a calendar superstition. It can still fail, but it fails for reasons you can examine, not because a four-year clock struck the wrong hour.

What 2026 Did to All Three

The year opened near $93,000. Under the cycle template, that number should not exist, a bear year is supposed to grind lower from the start, not open near highs. Then the Fed held, ETFs bled a record $4.5 billion in June, and price broke to a 21-month low near $58,200. Now the quantile model calls this level frozen and historically cheap, while the same June that crushed price is when the M2 deviation turned positive.

So the scorecard reads: the cycle template was wrong about January, the quantile model has been "cheap" since the mid $70,000s and bleeding the whole way down, and the liquidity signal is currently making a claim that won't be testable until autumn. Anyone telling you one of these frameworks called this year is grading on a curve.

The Participants Left, Not the Pattern

Here is the structural point underneath the chart drama. The cycle pattern was built on a specific market: halvings cutting new supply while demand came mostly from individuals reacting to price itself. That reflexive loop produced the boom-bust rhythm the templates memorized.

Today's marginal flow looks nothing like that. Spot ETFs move billions on allocation decisions made quarterly by committees. Corporate treasuries buy and sell against dividend schedules and debt covenants, as Strategy's new monetization framework just demonstrated. Miners increasingly earn from AI compute contracts that don't care what block rewards do. None of these participants know or care what year of the "cycle" it is. The pattern didn't break so much as its cast quit the show.


How to Actually Use This

A model earns attention in proportion to its mechanism, not its track record on three data points. The quantile bands are a useful way to see where price sits relative to its own history, nothing more. The four-year calendar deserves retirement honors and a quiet exit. The liquidity framework is the only one of the three making a falsifiable claim right now: if the positive M2 deviation persists and price hasn't followed within roughly a quarter, that model takes real damage too.

Our position hasn't changed since the M2 post. Watch the mechanism, hold it to a deadline, and treat every chart that fits the past perfectly as a description wearing a prediction costume. Three cycles is not a sample. It's an anecdote with better graphics.

This is market commentary, not financial advice. BitBrainers holds Bitcoin and other digital assets. Nothing here is a recommendation to buy or sell any asset. Do your own research.

When a Company "HODLs," Someone Else Decided That For Them

BitBrainers - When a Company 'HODLs,' Someone Else Decided That For Them

By BitBrainers Editorial

A person holding Bitcoin in self-custody answers to nobody about when to sell. A public company holding Bitcoin answers to a board, a dividend schedule, and an accounting standard. Strategy just gave the market a live look at the difference.

The Board Gave Itself Permission

On June 29, 2026, Strategy's board approved something it had never issued in nearly six years of buying Bitcoin: a standing authorization to sell it. The Digital Credit Capital Framework permits up to $1.25 billion in BTC sales, described as a monetization program rather than a liquidation, a permanent option on the table rather than an order.

The company still holds 843,775 BTC, the largest corporate Bitcoin position in the world, acquired at an average cost near $75,476 per coin. With Bitcoin trading in the low $60,000s, that position carries an unrealized loss of roughly $11 billion on paper.

The Bill That Doesn't Care What Bitcoin Does

The reason a "never sell" company built itself a selling mechanism has nothing to do with conviction. It has to do with STRC, Strategy's preferred stock, which now pays a 12% annual dividend as of July 1. That is a contractual cash obligation, and preferred shareholders don't care whether BTC is at 60K or 90K when the payment comes due.

Strategy's $2.55 billion USD reserve covers roughly 17 months of those obligations at current terms. When that runway shortens, or when raising fresh capital through stock or preferred issuance gets more expensive, the $1.25 billion authorization is the backstop. The market has also gotten less willing to pay a premium for MSTR relative to the Bitcoin it holds. That premium, the mNAV, has compressed from as high as 1.80x over the past year to around 1.11x now.

The mechanics behind the headlines, in your inbox.

No hopium, no price predictions. Just what's actually moving and why.

Subscribe

It's Already Happening, Just Not Through the Front Door

Strategy sold 3,588 BTC, about $216 million, between June 29 and July 5 to help fund that dividend payment. Per the company's own July 6 filing, that sale did not count against the $1.25 billion program at all.

VanEck's Matthew Sigel flagged the reason. The monetization program only caps sales used to rebuild the USD cash reserve specifically. Direct dividend-funding sales sit outside that number entirely. Strategy has more room to sell Bitcoin than the headline $1.25 billion figure suggests, and most of the market coverage hasn't caught up to that yet.

Strategy has technically sold before, once. In December 2022 it sold 704 BTC at $16,776 per coin, then repurchased 810 BTC two days later, a tax-loss harvesting move that banked a capital loss without reducing exposure. What makes June 29 different is that it isn't a one-off maneuver. It is permanent machinery for converting Bitcoin into cash whenever a fixed dividend needs funding.

The Bull Case Nobody's Wrong About

None of this means Strategy is in distress. The 3,588 coins sold amount to roughly 0.4% of the company's holdings, and the authorization itself has gone unused, with the company's own language stressing no obligation to sell exists. Sigel, who tracks the company closely, called it running "a hedge fund" trading its own capital stack, not a company in trouble, and said he's comfortable paying a low multiple for that structure.

A board building in optionality before it's forced to use it is closer to prudent governance than panic. The question this post cares about is narrower than bullish or bearish anyway: it's about who actually holds the decision to sell.

Where Individual HODL Diverges From Corporate HODL

A person holding Bitcoin in self-custody has no dividend clock, no board resolution, and no accounting rule forcing quarterly losses onto a public income statement. Strategy has all three. Under fair value accounting adopted in January 2025, every dollar Bitcoin drops shows up as a real loss on Strategy's books each quarter, whether or not a single coin gets sold.

That rule already showed its teeth this year. For the quarter ended June 30, 2026, Strategy reported an $8.32 billion loss on its digital asset holdings, a number that ran straight through the income statement regardless of whether a single coin traded hands. The market felt that loss before Strategy sold anything to address it.

An accounting rule, a board vote, and a preferred shareholder's dividend claim can all move Strategy's Bitcoin before the CEO forms an opinion on price. "HODL" as an individual ethos assumes the holder controls the decision. For a leveraged corporate treasury, that control is shared with people who were never asked whether they believe in Bitcoin. They just wanted their coupon paid.

Related on BitBrainers: Fear and Greed Says Buy. MVRV Says Not Yet. Long-Term Holders Aren't Waiting.


The Level That Actually Decides This

The scenario worth watching isn't whether Strategy sells more Bitcoin this month. It's whether BTC recovers back above that $75,476 average cost basis, because that line matters more than any headline dollar figure. Above it, this entire framework becomes a governance formality nobody remembers by next year. Below it for long enough, the $1.25 billion program stops being a backstop and starts looking like a schedule.

Sources:
Seeking Alpha: Strategy's Bitcoin sale raises fresh questions as $1.25B monetization plan remains unused
crypto.news: VanEck says Strategy's $135M BTC sale left $1.25B plan intact
CoinGecko: Strategy Bitcoin Treasuries: MSTR.US BTC Holdings Chart
Yahoo Finance: MicroStrategy Stops Just Hoarding Bitcoin, Now It Will Manage It Like Smart Money

[FLAG: insert your standard disclosure boilerplate here, not stored, so not invented]

— BitBrainers Editorial

Thursday, July 9, 2026

Bitcoin Has Rallied on "Iran Wants a Deal" Twice Since February. The First Time Was Almost the Same Words.

BitBrainers - Iran Deal Claims, A Repeating Pattern

By BitBrainers Editorial

Trump told reporters aboard Air Force One on July 9 that Iran "called a little while ago" and "wants to make a deal so badly." No Iranian official has confirmed that call happened.

This is not a new line. Almost the same words came out of the White House on March 23, four months ago, under almost the same circumstances.

Two of these claims already have a documented outcome. Neither one matches what the headline implied in the moment.

The Same Line, Four Months Apart

On March 23, Trump said the US had opened contact with Iran and would delay strikes on Iranian infrastructure for five days. His words that day, per Wikipedia's timeline of the negotiations: "They called, I didn't call. They want to make a deal."

Today's version: "They called a little while ago, they want to make a deal so badly." Different day, same structure, same unverified premise.

Bitcoin jumped more than 5% within minutes of the March 23 comments, touching $71,794 after sliding to a two week low near $67,371 that same morning. WTI crude fell 11%. The S&P 500 added roughly $2 trillion in value within twenty minutes.

Iran's Fars News agency disputed the framing the same day, saying the talks Washington described had not taken place.

The Kobeissi Letter flagged something else worth remembering. Roughly $1.5 billion in S&P 500 futures were bought fourteen minutes before Trump's announcement went out, repricing the index before the public had the headline at all.


The One That Was Real, For Three Weeks

Not every version of this claim has been empty air. Reports of a near agreement had circulated since late May, and on June 17 the Islamabad Memorandum was formally signed, with a ceremony in Switzerland two days later. The naval blockade on Iran was lifted the next day.

Bitcoin cleared $65,000 as the agreement firmed up, trading near $64,000-66,000 through most of that week, and spot ETF inflows turned positive after weeks of outflows. This time there was paperwork behind the claim, not just a statement to reporters.

Friction came back almost immediately. By June 20-21, Trump was threatening to invade Iran over fresh closure claims on the Strait of Hormuz. Open clashes resumed by June 28, and both sides briefly recommitted to standing down.

That didn't hold either. On July 6-7, Iran struck three tankers in the strait. On July 8, Trump called the entire arrangement over and ordered strikes on more than 80 targets.

The version of this story with an actual signature attached lasted three weeks. The unconfirmed ones haven't lasted three days.

Every headline moves the price before you can check it.

The Weekly Brief tracks what actually held up, not what got said in the moment.

Subscribe Free

What Today's Version Is Missing

The July 9 claim follows the March 23 shape closely. Contact with Iran, no independent confirmation, and an immediate market reaction, stock futures turning green, before anyone outside the White House could check any of it.

Trump's own wording undercuts the optimistic read. In the same breath, he said he didn't know if Iran was "worthy of making a deal" or whether they would "honor" one. That's not how someone talks about an agreement they think is close.


Why The Reaction Is Always This Fast

Oil and Bitcoin are both carrying a war premium right now, extra pricing tied to the risk that the Strait of Hormuz stays disrupted. Any claim of de-escalation, verified or not, mechanically unwinds part of that premium the moment it's said out loud.

That's why Bitcoin can move 3 to 5% on a single sentence from Trump before there's anything to confirm. In moments like this it isn't trading like a hedge. It's trading like a leveraged bet on whatever he says next.

The Trade Isn't The Headline

Whether Trump is telling the truth matters less than the gap between when a claim moves the market and when it can actually be checked. That gap runs minutes for the headline and days or weeks for confirmation.

The one instance with real paperwork behind it, a signed memorandum, a ceremony, a lifted blockade, bought three weeks. The unconfirmed ones haven't bought three days.

The signal worth watching isn't the next Trump quote. It's whether Iran's own officials confirm anything independently, and whether tanker traffic through Hormuz actually resumes. Both are slower than a headline. Both have been more reliable.


Still Ahead
June CPI lands July 14, the last inflation read before the July 28-29 FOMC decision. If the ceasefire cycle runs true to form, expect another version of today's claim before then, and another reversal not long after.

Sources
Bloomberg - Bitcoin Rises After Trump Says to Postpone Iran Strikes
Fortune - Bitcoin climbs as Trump grants five days for Iran negotiations
CoinDesk - Bitcoin Surges Above $71,000 as Trump Postpones Iran Strikes for Five Days
BeInCrypto (via Bitget) - Trump's Iran Signal Sparks Best-Timed Trade of 2026
Capital.com - Bitcoin price prediction 2026-2030: US-Iran Deal, ETF Outflows
CBS News - U.S.-Iran Latest: U.S. launches more strikes against Iran after Trump says ceasefire is "over"
CNN - July 8, 2026 - US, Iran threaten more attacks as strikes continue
Wikipedia - 2025-2026 Iran-United States negotiations
Wikipedia - 2026 Iran war

Disclosure: BitBrainers may hold positions in assets discussed. This is not financial advice.

Weekly Brief: The Week FOMC Decides Everything

By BitBrainers Editorial Bitcoin hit $66,400 on Tuesday, its highest since June 17, on seven straight days of ETF inflows. By Friday it ...