

By BitBrainers Editorial
The candle closed at $59,736, down 4.65% on the day. That is not a wick that recovered. That is a full close below every level the morning's bid data said would hold.
What the orderbook actually said
The data wasn't wrong about what existed. Multiple bid clusters were genuinely sitting between $60.8K and $62.5K, with the heaviest wall around $62.5K, over $12.5M deep. Resistance was capped above $63K. On paper, the setup read as a range, a floor underneath, a lid on top, nothing dramatic in either direction.
That reading wasn't fabricated. It was just incomplete, because an orderbook only shows you where resting orders are sitting right now. It cannot tell you whether those orders survive contact with enough forced selling.
The trigger wasn't crypto-native
The pressure came from outside the asset entirely. A tech and AI stock selloff dragged risk assets lower across the board, Bitcoin included, as investors rotated out of high-valuation names and into cash. That selling met a market already six straight weeks into spot Bitcoin ETF outflows, with the cumulative total past $4.4 billion since mid-May. Sticky inflation data and a delayed Fed rate-cut timeline did the rest, draining appetite for anything priced as risk.
None of that shows up in an orderbook. A bid wall reflects today's resting liquidity, not tomorrow's macro headline. When equities sell off hard enough, the same leveraged accounts that were providing depth at $62.5K become the accounts forced to pull their bids and sell into the move instead.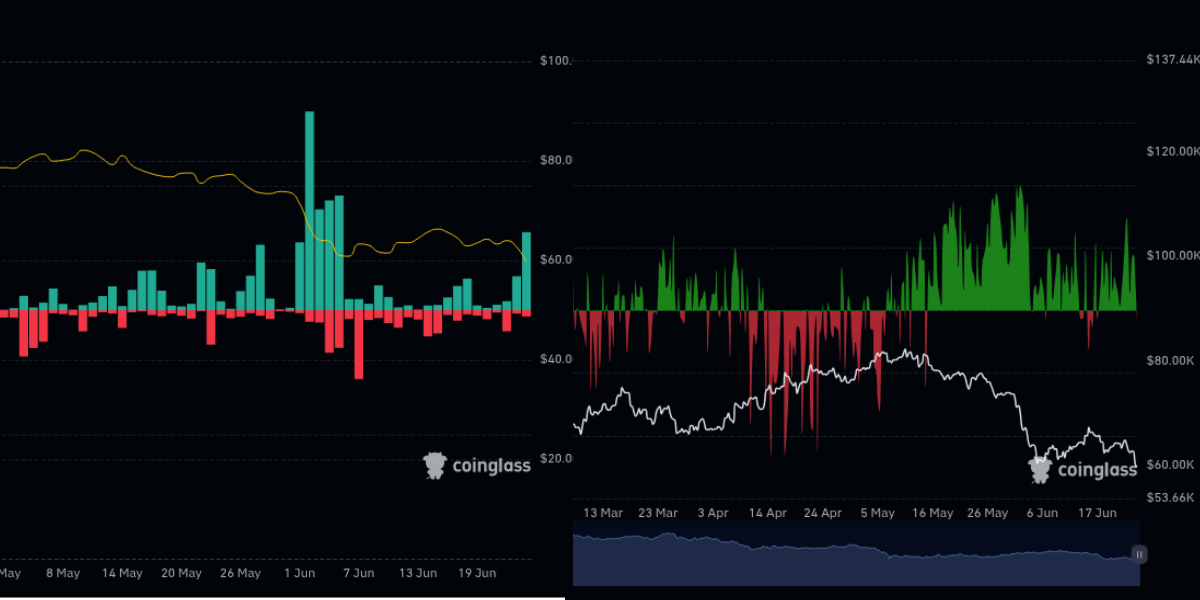
The mechanism: leverage doesn't hold, it gets forced out
This is where the liquidations matter, because they are the actual hinge between "the wall existed" and "the wall didn't hold." A bid on an exchange's orderbook is very often a leveraged long, not a spot buyer sitting patiently with cash. That distinction is everything when price starts moving against it.
A leveraged long doesn't get a vote on whether it keeps its position once price touches its liquidation price. The exchange closes it automatically, and that forced close becomes a market sell order hitting the book at the worst possible moment, right when price is already falling. Our own tracking showed two consecutive days of heavy forced closes, tens of thousands of traders each day, hundreds of millions in positions wiped per session. That is not normal churn. That is leverage getting walked out of the market whether it wanted to leave or not.
So the sequence reads like this. Tech stocks sell off. Risk-off money pulls back from crypto. Price drifts down toward the bid wall everyone was watching. The wall absorbs some of it, briefly, the way the morning's orderbook data suggested it would. But every dollar of that wall that was leveraged rather than spot gets force-closed the moment price ticks against it, and each forced close adds more selling pressure on top of the selling that was already happening. The wall does not get defended. It gets consumed and resold into the very move it was supposed to stop.
That is the difference between a depth chart and a battle. The depth chart shows you where the soldiers were standing this morning. It does not tell you how many of them were already wounded.
Why this is worth saying plainly
It would be easy to quietly drop this morning's read and move on. That is not how this works here. The orderbook said support was real, and a few hours later price proved that support was thinner than the depth chart implied, partly because the news flow turned, and partly because a meaningful share of that depth was leverage that never had the chance to choose whether to stay.
The lesson isn't that orderbook data is useless. It's that depth tells you where buyers were willing to stand, not whether they will keep standing once the floor under them starts shaking too, and not how much of that depth was even theirs to keep. A bid wall is a snapshot, not a guarantee. Today is the difference between the two.
Don't miss the next breakdown
Macro reads on Bitcoin, regulation, and the stories nobody else is connecting. Straight to your inbox.
Subscribe FreeWhat we're watching next
Whether tomorrow's session reclaims any part of the $60.8K-$62.5K zone, or whether the break confirms and that range becomes resistance instead of support. Worth watching ETF flow data too. A slowdown in outflows would be the first real sign this leg is running out of fuel.
Sources
Mudrex Learn, Why Is Bitcoin Down Today?
Disclosure: This article is for information only and is not financial, investment, or legal advice. Always do your own research.

