₿ BTC Loading... via Binance

Saturday, June 27, 2026

Absorption or Exhaustion: What BTC's Slow Bleed to $58K Is Telling Traders.

BitBrainers - Absorption or Exhaustion

By BitBrainers Editorial

Bitcoin has now made the trip down to the $60,000 zone twice this year, and the two trips don't look anything alike. The first one was fast and ugly. This one has been slow, quiet, and is still going. That difference matters more than the price action itself.

Same Floor, Different Speed

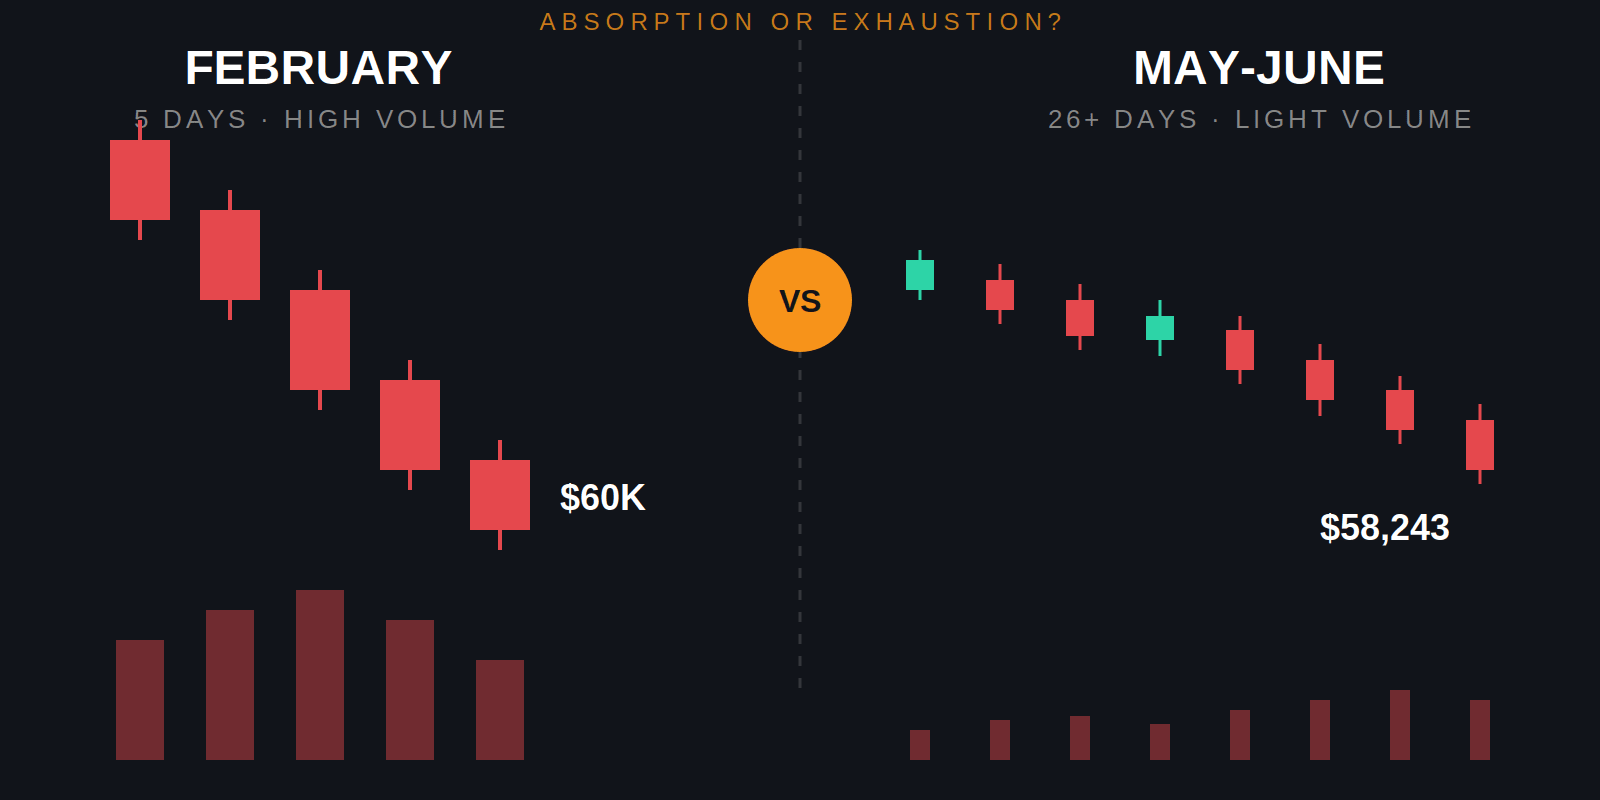
In February, Bitcoin dropped from the low $80,000s into the $60,000 zone in about five trading days. Big red candles, heavy volume, the kind of move that liquidates leveraged longs in bulk rather than asking nicely. That was a flush.

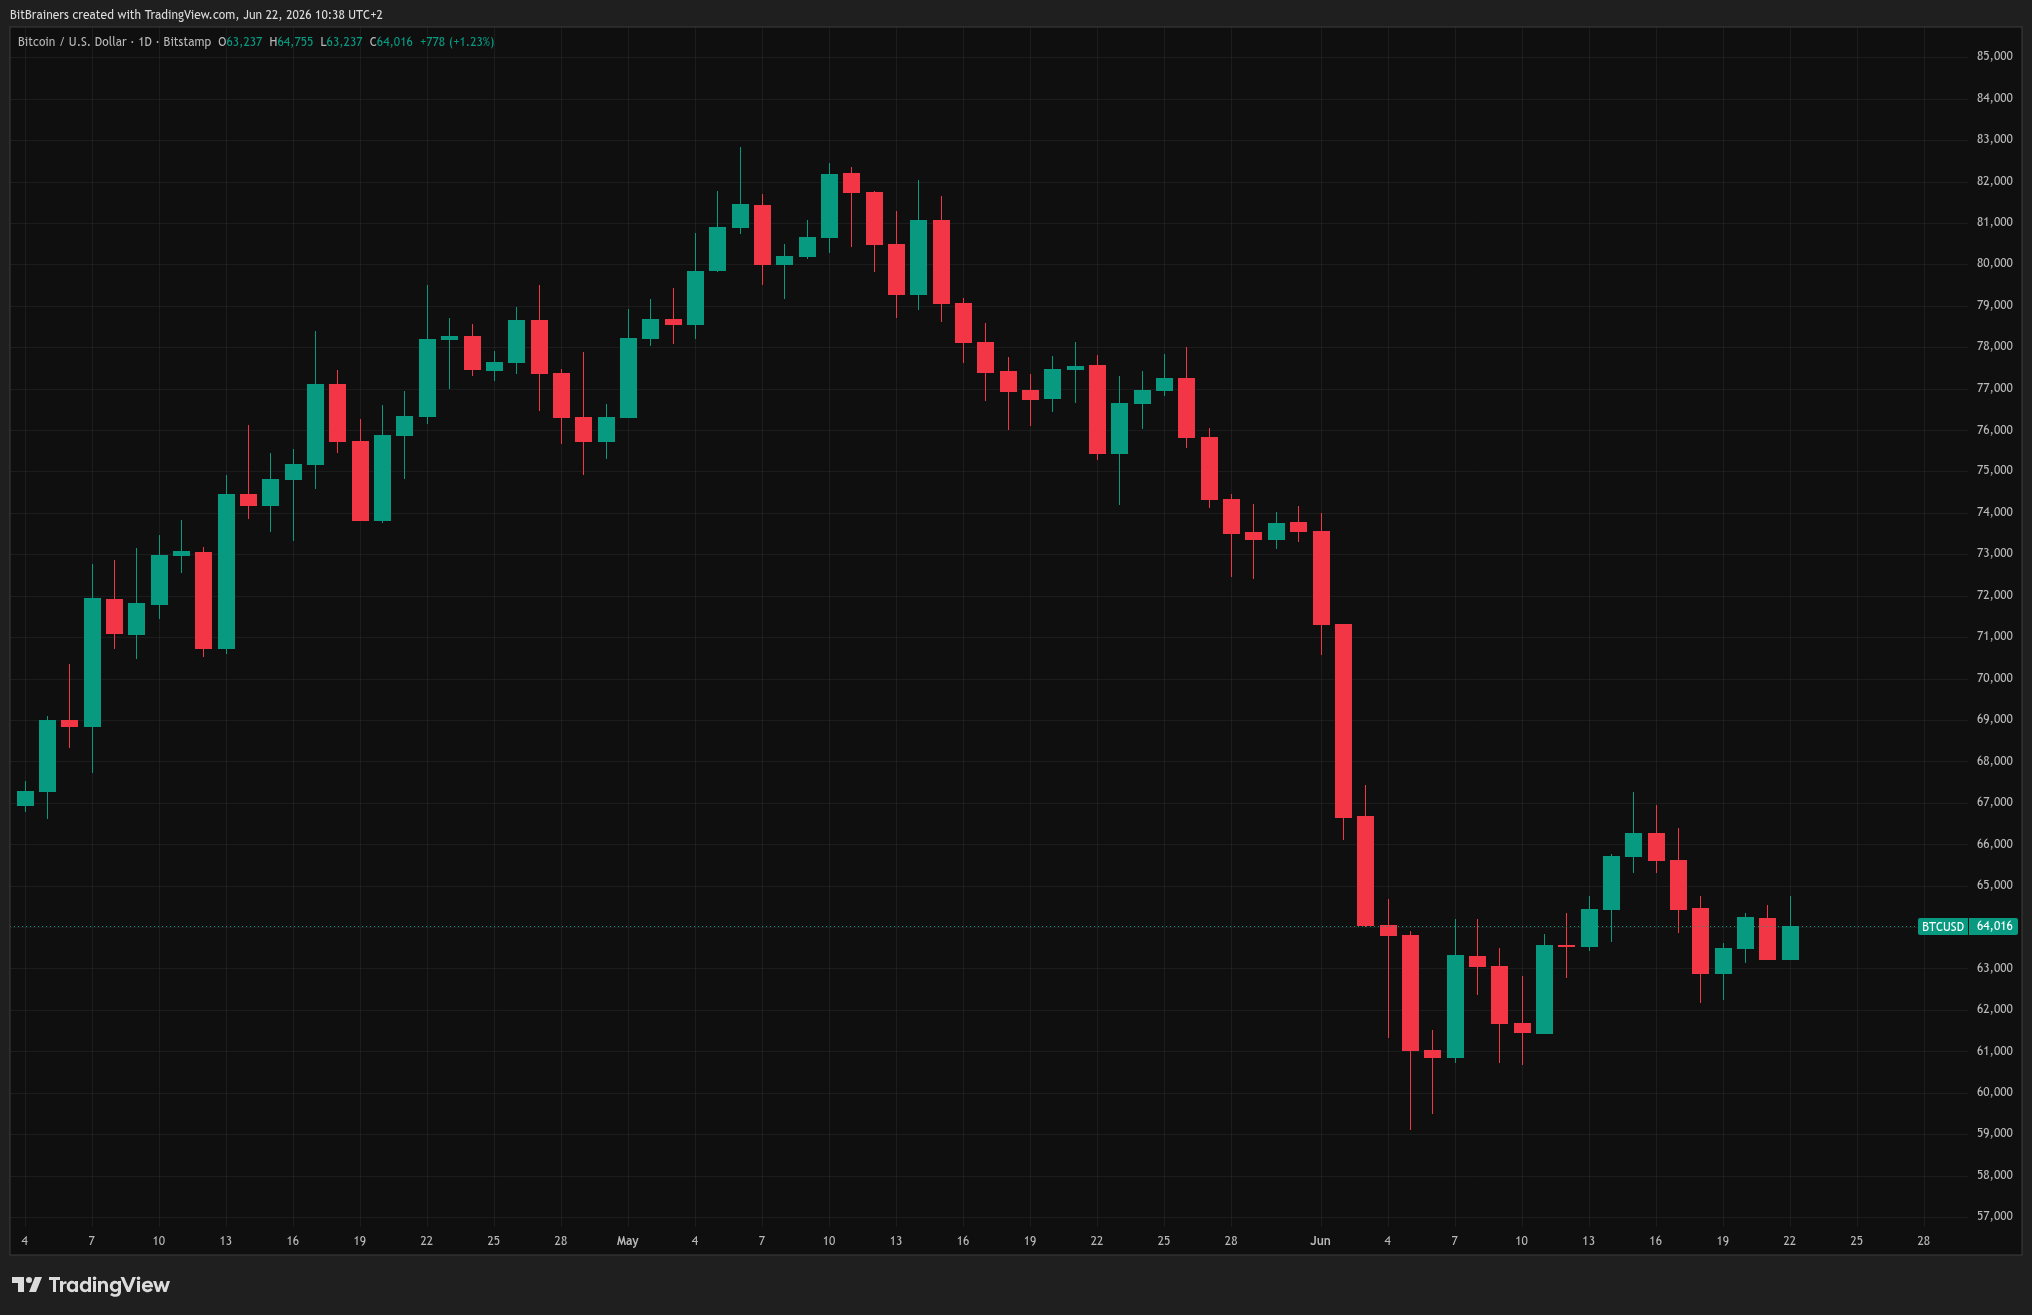
Bitcoin then recovered, climbed back into the $73,000-$77,000 zone by May, and rolled over again. This time the same trip, roughly the same distance, took around 26 days instead of five. And the volume behind it was a fraction of February's. Then came a bounce toward $67,000 that failed to hold, followed by an 11-day grind lower into a $58,243 low this week, again on volume lighter than the leg before it.

Same destination, three different speeds, each one slower and quieter than the last.


What Slower Usually Means

In Wyckoff-style market reading, this pattern has a name: absorption. The idea is straightforward. February's flush forced out the most leveraged, most panic-prone holders in one violent move. If most of that supply already left the market then, there's simply less forced selling left to do the same job a second time, which would explain why this leg needed five times longer to cover the same ground.

That's the optimistic read. It is not the only one. Light volume on a slow decline is just as consistent with the opposite story, buyers who have no urgency to step in, letting price drift lower because nothing is forcing them to defend a level. Both stories produce the exact same chart. The volume tells you effort is dropping. It doesn't tell you whose effort.

This is the kind of read you get weekly.

No hype. No "this coin will 100x." Just honest macro on Bitcoin, gold, and the market.

What Actually Moved This Week

The trigger behind this latest leg wasn't crypto-native. It was the May PCE inflation print, the Fed's preferred inflation gauge, coming in at 4.1% year-over-year, the hottest reading since 2023 and more than double the Fed's 2% target. Markets immediately repriced the odds of a December rate hike to around 77%, with Bank of America now modeling three hikes in 2026 and Deutsche Bank expecting two starting as early as September.

That kind of shift is bad news for anything priced on the assumption that money stays cheap. The inflation surprise triggered roughly $1.48 billion in crypto-wide liquidations within 24 hours, with Bitcoin alone accounting for about $665 million of that. It's also landing on top of six weeks of spot Bitcoin ETF outflows, nearly $6 billion over the past 30 days, the largest monthly exodus of the year.

None of that is a Bitcoin story. It's a rates story that Bitcoin happens to be sitting inside of. There's a second force working in the same direction: speculative capital that would normally chase crypto on a good week has been rotating into AI infrastructure stocks instead. The Nasdaq 100 erased an intraday rally on the same inflation news that hit Bitcoin, and the two markets have tracked each other closely all year. When the trade everyone wants exposure to is chips and data centers, Bitcoin doesn't need a crypto-specific reason to get starved of fresh demand. It just needs to not be the thing winning that week.


What Would Actually Settle This

A chart can't prove which read is right. Only a reaction can. If $67,000 gets reclaimed and held on real volume, the absorption case gets stronger. If price keeps bleeding lower and the next leg down comes on rising volume instead of fading volume, that's the distribution case confirming itself instead.

The specific thing to watch for is what traders call a spring: price briefly punches below a level everyone's watching, then snaps back above it fast, on rising volume, trapping the people who shorted the breakdown. A bounce that reclaims a level but fades back into the range on light volume isn't that. It has to hold, with volume expanding behind it, not just touch the level and retreat.

Right now neither has happened. Bitcoin is sitting at the lows, the bounce attempts have been weak, and demand hasn't shown up in any way that forces a real reaction. That's not a bottom call. It's a "the chart got interesting, prove it" situation, and so far nobody's proven anything.

On The Radar

Watch $67,000 on the next bounce attempt, and watch whether volume rises or keeps fading on the next leg in either direction. Friday's $10 billion Deribit options expiry also resets a chunk of the positioning that's been shaping this range, and that kind of reset doesn't always settle in a single day. Pinning or volatility effects from it can keep showing up for several days after expiry, not just on the day itself. More on the expiry mechanics in our max pain breakdown.


Sources:
CryptoTickerCrypto Prices Today: Why Bitcoin Slipped Below $60,000 Again
CoinStats AIBitcoin (BTC) Daily Market Analysis

Disclosure: This is not financial advice. We hold positions in BTC and discuss our own trades publicly, wins and losses.

You Might Also Like: The Fed Chair Who Loved Bitcoin

Friday, June 26, 2026

Strategy Says Its Bitcoin Covers The Dividend For 32 Years. The Real Number Is Different.

Michael Saylor speaking at CPAC 2025, photo by Gage Skidmore

Photo: Gage Skidmore, CC BY-SA 2.0

By BitBrainers Editorial

Strategy says its Bitcoin reserve covers STRC's dividend for 32 years. CryptoQuant says the real number is 14 months. Both claims came from real math. Only one of them survived contact with this week's price action.

Thursday, June 25, 2026

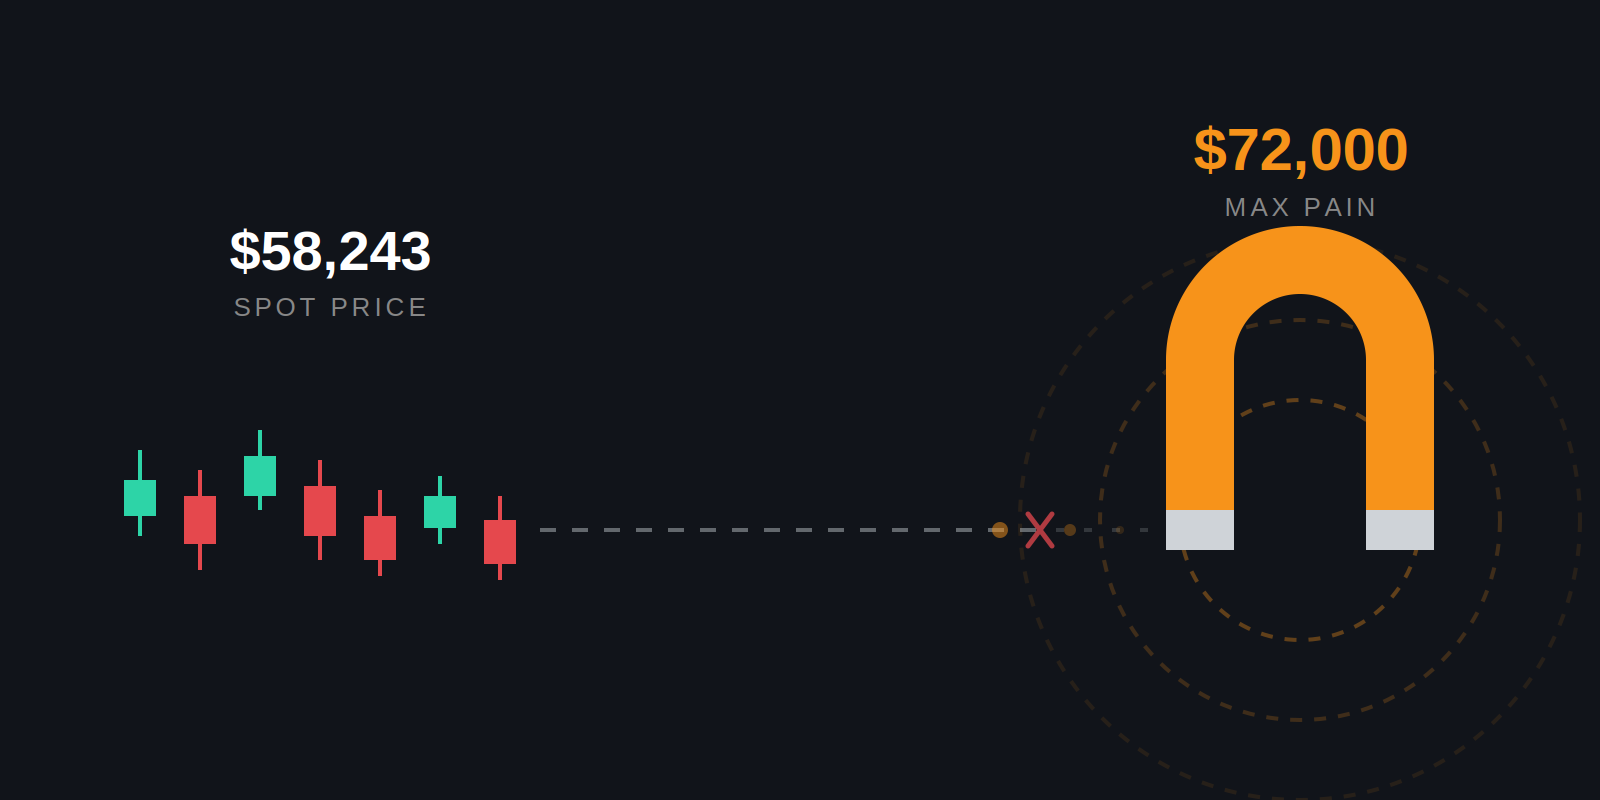
What Is Max Pain in Bitcoin Options and Why It's Not Working This Time.

BitBrainers - Max Pain Theory Bitcoin Options

By BitBrainers Editorial

Every quarter, somewhere on crypto Twitter, someone explains that Bitcoin's price is about to get pulled toward a number called "max pain." It sounds like inside knowledge. Most of the time it's a theory doing a lot of work it can't actually back up, and this week is a clean example of it failing in real time.

The Fed Chair Who Loved Bitcoin

BitBrainers - The Fed Chair Who Loved Bitcoin

By BitBrainers Editorial

Kevin Warsh personally owned stakes in more than thirty crypto assets before he became the most powerful man at the Federal Reserve. He once called Bitcoin "the newest, coolest software" and compared it to gold for investors under forty. Then he chaired his first policy meeting as Fed Chair, and Bitcoin had one of its roughest stretches in months.

Wednesday, June 24, 2026

The Orderbook Said There Was Support. Bitcoin Broke It Anyway.

BitBrainers - Bitcoin orderbook support breaking

By BitBrainers Editorial

This morning the orderbook looked solid. Bids stacked from $60.8K to $62.5K, a wall thick enough that the read was simple, support is real here, upside is what's capped. By tonight's close, Bitcoin had gone straight through it.

Crypto Gets Regulated Into the Ground. Meta Builds a Betting App for 3.5 Billion People.

Smartphone glowing in the dark with betting odds reflected on a face, no text

By BitBrainers Editorial

When news broke this week that Meta is building a prediction-market app, the most honest reaction did not come from a regulator or a journalist. It came from the stock market. Shares of DraftKings and Robinhood, two of the biggest names in legal betting, slid the moment the report hit. They were not confused about what Mark Zuckerberg is building. They recognised a competitor. That reaction tells you more than any press release will, because the gambling industry knows a gambling product when it sees one, even when nobody is calling it that.

Tuesday, June 23, 2026

BofA Just Changed Its Fed Call. Bitcoin Should Care More Than It Does.

BitBrainers - Federal Reserve building, rate hike signal

By BitBrainers Editorial

Bank of America spent most of this year telling clients the Fed would hold rates steady through 2026. On Monday it reversed that call. The bank now expects three separate rate hikes before the year ends, in September, October, and December, lifting the federal funds rate toward a range of 4.25 to 4.5 percent. The reason given is straightforward: core inflation is running hotter than expected, and the bank thinks policymakers are increasingly worried it is not temporary.

That is a real shift, not a rounding error. A bank moving from steady to three hikes in one note is the kind of call that changes how every other desk prices risk for the rest of the year. Bitcoin barely moved on the headline. That gap between the size of the news and the size of the reaction is the actual story.


Why This Is The Chain We Have Been Watching

A hawkish Fed call is not abstract for an asset like Bitcoin. It pays no yield. Every basis point the Fed adds to the safe rate raises the opportunity cost of holding something that pays nothing while it sits there. That is the entire mechanism, and it does not care how the asset is described in headlines. Gold faces the identical pressure for the identical reason, which is why a softening gold price often moves in the same direction as a softening Bitcoin price when this lever is the one being pulled.

BofA's note cited core personal consumption expenditures, the Fed's preferred inflation gauge, potentially reaching 3.5 percent, roughly 70 basis points above where it sat a year earlier. That is the number that actually matters here, more than any chart pattern. Inflation running hot is the input. Hawkish Fed commentary is the output. Higher real yields are the transmission. Pressure on non-yielding assets is the result. None of that chain runs through a ceasefire ticker or an exchange order book.

Read also: Bitcoin Weekly Brief: June 22 — The Ceasefire Is Cracking And Bitcoin Doesn't Care

This is the kind of read you get weekly.

No hype. No "this coin will 100x." Just honest macro on Bitcoin, gold, and the market.

The Part That Looks Like A Contradiction But Is Not

Strategy bought another 520 Bitcoin this week for roughly 35 million dollars, the same day this Fed news was landing. On its face that looks like conviction buying straight into a hawkish turn. Look closer and it is less dramatic. The purchase price was around 67,000 dollars. Strategy's average cost basis across its full holding is 75,651 dollars. The company bought below its own average, which is simply the dollar-cost-average strategy it has run for years, continuing on schedule. It is not a signal that someone with privileged information is shrugging off a more hawkish Fed. It is a company executing the same plan it always executes, regardless of what the macro backdrop is doing that week.

The two facts sitting next to each other, a bank turning more hawkish and a public company continuing to buy on its usual schedule, are not in tension. They are simply two different actors operating on two different time horizons. One is repricing risk for the next six months. The other is averaging in over years. Neither one tells you what happens next week.


What Actually Changed And What Did Not

Bitcoin's range has not broken. Price is still sitting in the low to mid 60,000s, the same zone it has held through the ceasefire noise we covered last week. What changed is the macro backdrop underneath that range got less friendly, not more. A market that hopes for rate cuts to justify higher prices for risk assets just had one of its larger banks tell clients to expect the opposite. That does not guarantee a breakdown. It removes one of the arguments for a breakout higher.

The honest position here is the boring one. Watch the inflation prints between now and September. Watch whether other banks follow BofA's lead or push back on it. The Fed call that actually matters is the Fed's own, not a single desk's forecast of it. Until that lands, this is a backdrop that got tighter, not a verdict.

Sources

Yahoo Finance / CoinDesk, Bitcoin Is Stuck Near $64,000 As ETF Outflows Reach A Sixth Week
Yahoo Finance, Bitcoin News: Digital Dollar Blocked To 2030 While Staking Tax Bill Stalls In Congress

BitBrainers. We check the facts so you don't have to.

Disclosure: This post is market commentary, not financial advice. We hold Bitcoin. Nothing here is a recommendation to buy, sell, or use leverage.

Monday, June 22, 2026

Bitcoin Weekly Brief: June 22 — The Ceasefire Is Cracking And Bitcoin Doesn't Care.

BitBrainers - Bitcoin daily chart, range-bound in the low 60,000s

By BitBrainers Editorial

Two ceasefires have failed this year, and Bitcoin gave back the entire rally both times. A third framework was signed on June 17. This week it started cracking, and the thing worth noticing is what Bitcoin did about it. Almost nothing.

BTC spent the week stuck in the low 60,000s, roughly 63,000 to 64,000, while the headlines screamed. That is the real story of this week. Not the war, not the deal, but the fact that price has stopped flinching at either one.

Nobody Sold The Bottom. They Were Sold.

BitBrainers - Bitcoin liquidation cascade, dominoes tipping

By BitBrainers Editorial

Roughly 1.8 billion dollars in Bitcoin positions were force-closed in a single day this month, the heaviest flush since February, and long positions absorbed about three quarters of the damage. Read that number again, because the word everyone reaches for is wrong. Almost nobody in that 1.8 billion chose to sell. They were sold, automatically, by the exchange, at a price they never agreed to. That distinction is the whole story, and it is the one the headlines skip.

Sunday, June 21, 2026

Bot Signal Watch #4: I Put My Own Bot on Trial. It Lost.

In the last Bot Signal Watch, the bot almost won and I refused to call it one. A long that came a few dollars short of its target, reported as still open, because "almost" is not a fill. A few people told me I was being too hard on it.

This one is harder than that. I stopped watching individual signals and put the whole strategy on trial. The verdict is in, and it's not the one I was hoping for.

The question I should have asked sooner

Every Bot Signal Watch so far has tracked what the bot did this week. Won here, lost there, sat on its hands. That's fine for a diary, but it never answered the real question: does the strategy actually have an edge, or have I been narrating a coin flip?

There is a proper way to answer that, and it isn't "look at this month's trades." It's a walk-forward test. You take years of price data, split it in two, let the strategy pick its best settings on the first half, then run those exact settings on the second half it has never seen. If the edge is real, it survives on the unseen data. If it was just fitted to the past, it falls apart. And you apply real fees and slippage to every trade, because a strategy that's profitable before costs and negative after costs is just a donation to the exchange.

Ten tests, one answer

I ran the bot's EMA cross logic this way across Bitcoin and Ethereum, on three timeframes. Then I tested the opposite idea, mean reversion, the same way. Ten tests in total. Here is the part that matters, the out-of-sample result, the half the strategy never got to practice on:

Test Out-of-sample return Verdict
EMA cross, BTC 15m (the live bot)-52%Fails
EMA cross, BTC 4h-2.6%Fails
EMA cross, ETH 15m-27%Fails
Mean reversion, BTC (all timeframes)-14% to -77%Fails
Mean reversion, ETH 15m / 1h-63% to -79%Fails
One outlier (ETH 4h, both strategies)positiveToo few trades to trust

No version of the live bot's strategy survives. Not the 15-minute cross it actually runs, not a slower 4-hour version, not on Bitcoin, not on Ethereum. The single positive cell came from one corner of the data with so few trades that it tells you nothing, and I'll come back to why that one is a trap, not a discovery.

Why it loses, in plain terms

The cross strategy dies from a thousand small cuts. On 15 minutes, price chops back and forth across the moving averages constantly. The bot catches the occasional big move, those trades are real winners, but in between it gets whipsawed into dozens of tiny losses. The few wins can't outrun the steady bleed, and the fees finish the job.

Moving to a 4-hour chart fixes the chop, and for a moment it looked promising. But once the whipsaw was gone, what was left underneath was just a coin flip. Roughly equal wins and losses, and every flip costs you the spread. A coin flip that charges admission is not a strategy.

Mean reversion, betting that price snaps back to its average, was supposed to feed on exactly that chop. It didn't. It bleeds a different way: it wins small and often, then a real trend rips straight through the band and the stop-loss takes one brutal loss that erases a week of small wins. During the big moves of the last two years, price kept trending instead of reverting, and the strategy paid for it.

The trap I didn't fall into

One result came back glowing. Ethereum on the 4-hour chart showed a strong positive return and a high win rate, on both strategies. It would have been easy to point at that and say I'd found something.

It was built on fewer than forty trades. That is not enough to separate skill from luck. And here is the tell: it was the only positive cell across all ten tests, and it lit up for two completely different strategies in the same spot. When two opposite approaches both look good in the exact same corner of the data and nowhere else, that corner is a quirk of one period, not an edge. You need hundreds of trades before a number like that means anything. I have a few dozen. So I'm filing it as noise, which is what it is.

What I'm actually telling you

The bot does not have an edge. I tested it more honestly than most people ever test the systems they sell you, and the honest answer is no. That's the whole reason this series exists, to show the part nobody screenshots.

This isn't a sad ending. The point of running it as paper, in public, with nothing real on the line, was to find this out before it cost anything. It did its job. The infrastructure stays, the testing discipline stays, and the next thing I try will go through the exact same gauntlet before it earns a single dollar of risk.

If anyone ever shows you a bot with a perfect record and no losing weeks, ask them for the out-of-sample test with fees included. The silence that follows is the most honest data point you'll get.

Nothing here is financial advice. It's a record of testing a strategy and finding it wanting. Do your own research.

By BitBrainers Editorial

A Betting Line Is Not a Headline: Prediction Markets

BitBrainers - A Betting Line Is Not a Headline

Kraken added them. Binance added them. Arkham added them. In a matter of months, prediction markets went from a Polymarket-and-Kalshi curiosity to a feature nearly everyone in crypto suddenly wants in their product. And the financial press now quotes them the way it used to quote economists.

That second part is the problem.

When a market reads "63 percent chance Bitcoin hits 50k first," that number is a wager. People put money behind a guess. But by the time it reaches your feed, an account has screenshotted it, stripped the context, and posted it as if a crowd of bettors uncovered a fact. The wager becomes a forecast. The forecast becomes a headline. The headline quietly shapes what you believe the market already knows. None of it was knowledge. It was odds dressed for the evening news.

The Double Standard Nobody Says Out Loud

Here is the part worth sitting with. Crypto spent years being told to wait in the corner. Age gates, risk disclosures, restricted access, regulators warning retail away at every turn. Buy Bitcoin and you get a lecture about volatility.

Bet on Bitcoin's price on a prediction market and you get the lighter 18-plus finance treatment, aggressive expansion across every major venue, and a free pass into the news cycle.

The reason comes down to one word: classification. Prediction markets are regulated as derivatives, which means finance, which means the gentler rulebook and the lower age line. A sportsbook taking the same kind of bet on a game is gambling, which in many places means 21-plus and a heavier hand. Same act, betting on an outcome. Different label. The label decides the rules.

Age Limits Were Never the Real Safeguard

The usual defense is that protections exist, that there is an age limit. An 18 limit gets crossed the same way a 21 limit gets crossed. That was never where the safety lived.

The real question is not who is technically allowed to click the button. It is why these venues get to manufacture public opinion at all, while the asset they are wagering on stays under restriction and suspicion. One side of this gets to set the narrative. The other side gets policed for participating in it.

What This Actually Is

Prediction markets are not useless. At their best they aggregate information better than pundits, because money tends to be more honest than talk. The issue is not that a probability exists. The issue is the laundering. The moment a bet gets dressed up as analysis and pushed into your feed as if a crowd settled a question it only gambled on.

So the next time you see "the market is pricing in" sitting next to a clean percentage and a Bitcoin headline, ask the boring questions. Priced in by whom. With what money. And who screenshotted it for you. The honest answer is usually a betting line, an account chasing engagement, and you.

By BitBrainers Editorial

Disclosure: This is opinion and market commentary, not financial advice. Do your own research.

The Fed Meets Tomorrow. Bitcoin Is Watching the Wrong Number.

By BitBrainers Editorial Tomorrow at 2pm ET, the Federal Reserve announces whether the fed funds rate holds at 3.50 to 3.75 percent o...

The Fed Meets Tomorrow. Bitcoin Is Watching the Wrong Number.