
By BitBrainers Editorial
Same Floor, Different Speed
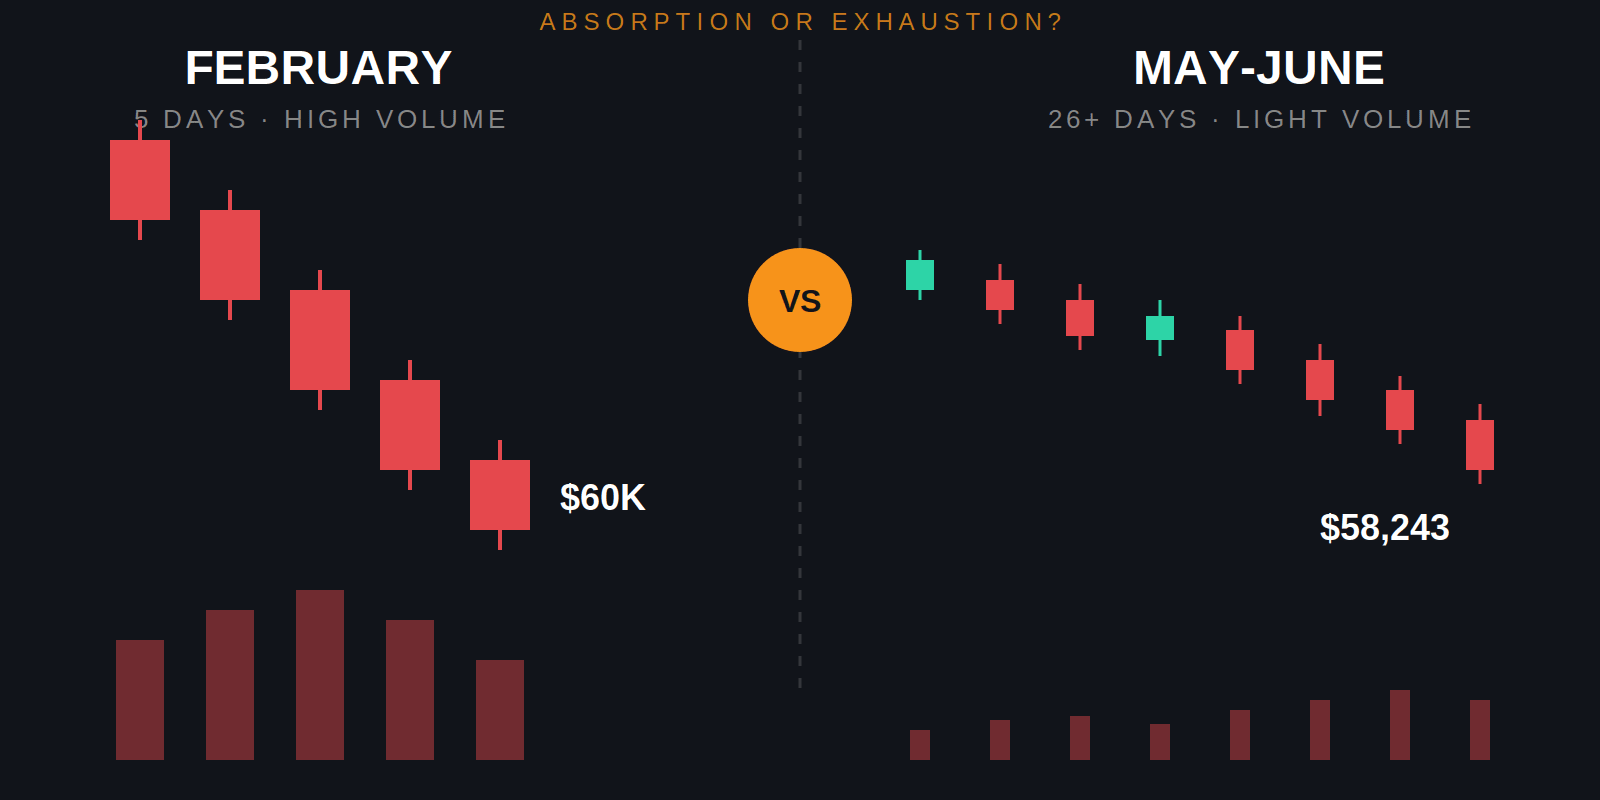
In February, Bitcoin dropped from the low $80,000s into the $60,000 zone in about five trading days. Big red candles, heavy volume, the kind of move that liquidates leveraged longs in bulk rather than asking nicely. That was a flush.
Bitcoin then recovered, climbed back into the $73,000-$77,000 zone by May, and rolled over again. This time the same trip, roughly the same distance, took around 26 days instead of five. And the volume behind it was a fraction of February's. Then came a bounce toward $67,000 that failed to hold, followed by an 11-day grind lower into a $58,243 low this week, again on volume lighter than the leg before it.
Same destination, three different speeds, each one slower and quieter than the last.
What Slower Usually Means
In Wyckoff-style market reading, this pattern has a name: absorption. The idea is straightforward. February's flush forced out the most leveraged, most panic-prone holders in one violent move. If most of that supply already left the market then, there's simply less forced selling left to do the same job a second time, which would explain why this leg needed five times longer to cover the same ground.
That's the optimistic read. It is not the only one. Light volume on a slow decline is just as consistent with the opposite story, buyers who have no urgency to step in, letting price drift lower because nothing is forcing them to defend a level. Both stories produce the exact same chart. The volume tells you effort is dropping. It doesn't tell you whose effort.
This is the kind of read you get weekly.
No hype. No "this coin will 100x." Just honest macro on Bitcoin, gold, and the market.
What Actually Moved This Week
The trigger behind this latest leg wasn't crypto-native. It was the May PCE inflation print, the Fed's preferred inflation gauge, coming in at 4.1% year-over-year, the hottest reading since 2023 and more than double the Fed's 2% target. Markets immediately repriced the odds of a December rate hike to around 77%, with Bank of America now modeling three hikes in 2026 and Deutsche Bank expecting two starting as early as September.
That kind of shift is bad news for anything priced on the assumption that money stays cheap. The inflation surprise triggered roughly $1.48 billion in crypto-wide liquidations within 24 hours, with Bitcoin alone accounting for about $665 million of that. It's also landing on top of six weeks of spot Bitcoin ETF outflows, nearly $6 billion over the past 30 days, the largest monthly exodus of the year.
None of that is a Bitcoin story. It's a rates story that Bitcoin happens to be sitting inside of. There's a second force working in the same direction: speculative capital that would normally chase crypto on a good week has been rotating into AI infrastructure stocks instead. The Nasdaq 100 erased an intraday rally on the same inflation news that hit Bitcoin, and the two markets have tracked each other closely all year. When the trade everyone wants exposure to is chips and data centers, Bitcoin doesn't need a crypto-specific reason to get starved of fresh demand. It just needs to not be the thing winning that week.
What Would Actually Settle This
A chart can't prove which read is right. Only a reaction can. If $67,000 gets reclaimed and held on real volume, the absorption case gets stronger. If price keeps bleeding lower and the next leg down comes on rising volume instead of fading volume, that's the distribution case confirming itself instead.
The specific thing to watch for is what traders call a spring: price briefly punches below a level everyone's watching, then snaps back above it fast, on rising volume, trapping the people who shorted the breakdown. A bounce that reclaims a level but fades back into the range on light volume isn't that. It has to hold, with volume expanding behind it, not just touch the level and retreat.
Right now neither has happened. Bitcoin is sitting at the lows, the bounce attempts have been weak, and demand hasn't shown up in any way that forces a real reaction. That's not a bottom call. It's a "the chart got interesting, prove it" situation, and so far nobody's proven anything.
On The Radar
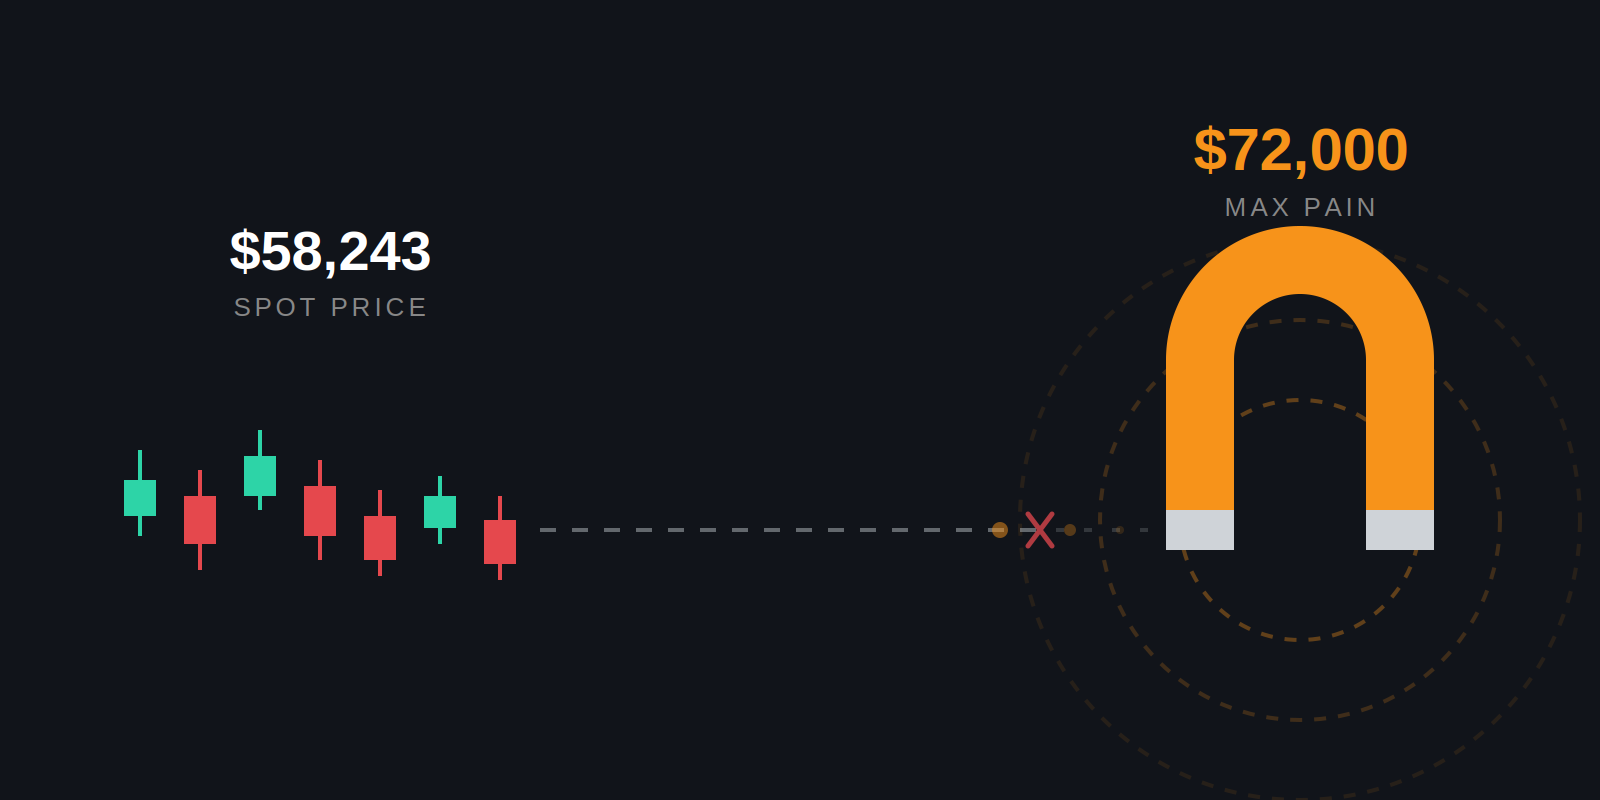
Watch $67,000 on the next bounce attempt, and watch whether volume rises or keeps fading on the next leg in either direction. Friday's $10 billion Deribit options expiry also resets a chunk of the positioning that's been shaping this range, and that kind of reset doesn't always settle in a single day. Pinning or volatility effects from it can keep showing up for several days after expiry, not just on the day itself. More on the expiry mechanics in our max pain breakdown.
Sources:
CryptoTicker — Crypto Prices Today: Why Bitcoin Slipped Below $60,000 Again
CoinStats AI — Bitcoin (BTC) Daily Market Analysis
Disclosure: This is not financial advice. We hold positions in BTC and discuss our own trades publicly, wins and losses.



.jpg)