₿ BTC Loading... via Binance

Monday, July 6, 2026

Bitcoin Weekly Brief: July 6 — The President Made $1.2 Billion From Crypto. The Senate Noticed.

By BitBrainers Editorial

Good Monday morning. Bitcoin is trading near $63,252, up about 1.5% on the day, with the Fear and Greed Index at 22. The Senate is still on recess, the Fed does not meet for another three weeks, and the biggest crypto story of the week came from a 927-page ethics filing rather than a chart.

That filing is going to follow the market into July. Here is why.

Where Bitcoin Sits This Morning

Bitcoin spent last week clawing back from a 21-month low under $58,000 and is now pressing the low $63,000s. The bounce came on two things: a weak June jobs report that showed just 57,000 new payrolls, and the first green ETF day in two weeks.

The level that matters is still $63,800. Multiple analysts have flagged it as the point where the downtrend structure breaks — specifically, where Bitcoin clears the lower high from the June decline and changes the technical picture from a series of lower highs to something more constructive. Price is roughly $550 below it as of this morning, close enough that one decent catalyst closes the gap.

Context matters here. Late June gave us the first weekly close below the 200-week moving average since 2023, a line Bitcoin has only lived under during the worst stretches of past bear markets. A recovery from that kind of technical damage needs follow-through, not one good week.

The 927 Pages Hanging Over the CLARITY Act

On Tuesday the Office of Government Ethics released President Trump's annual financial disclosure. It runs 927 pages, one of the longest ever filed by a sitting US president, and it reports more than $1.2 billion in crypto-related income for 2025.

The breakdown: $635 million in royalties from a group called "Celebration Coins" tied to his memecoin business, and over $526 million from sales of cryptocurrency tokens tied to World Liberty Financial, the crypto firm co-founded by members of his family. The White House says there are no conflicts of interest. Senate Democrats spent Wednesday saying otherwise, loudly.

Why this matters for price: the CLARITY Act, the market structure bill the entire US crypto industry has been waiting on, is stuck in the Senate on exactly one unresolved dispute. The ethics provision covering government officials holding personal crypto. The president just filed a public document showing he earned more from crypto last year than most exchanges did.

The Senate returns from recess on July 13 with roughly three working weeks before the August break. The disclosure hands Democrats fresh ammunition for the ethics fight at the worst possible moment for the bill's timeline. If CLARITY does not advance before recess, it slides toward 2027, and the market knows it.

The Flow Test: One Green Day Is Not a Trend

Thursday's session brought $221.7 million into US spot Bitcoin ETFs, the largest daily inflow in two months. It ended a ten-day streak that drained $2.73 billion from the complex and capped the worst ETF month on record, with June outflows north of $4 billion.

Look inside the number before celebrating. Fidelity's FBTC took in $166 million and ARKB added $92 million, but BlackRock's IBIT, the largest fund in the group, still bled $40 million on its eleventh straight red day. When the biggest holder base keeps de-risking while smaller funds turn green, that is reallocation, not fresh conviction.

Year-to-date net outflows still sit at $5.4 billion. Research this year estimates ETF flows now explain close to half of weekly Bitcoin price moves, so this ledger is not a sentiment indicator. It is a structural input. The test this week is simple: does Thursday get a second and third green day, and does IBIT stop bleeding.

The disclosure everyone skimmed. The flows everyone missed.

We read the boring documents so your Monday starts sharp. Free, every week.

Subscribe Free

Key Levels This Week

$63,800 Flip line. Clearing this breaks the lower high structure from the June decline. Next resistance sits at $66,600 to $67,600.
~$63,252 Current price. Roughly $550 below the flip line. The 20-day moving average near $62,500 needs to hold as support.
$56,200 Support. A break here opens the $50,000 to $53,000 zone.
$53,000 Realized price floor. Aggregate cost basis of all circulating supply. A sustained break puts the average holder underwater and removes the structural argument for the bull case.

The Calendar From Here

July 13, Senate returns. The CLARITY window reopens with the ethics clause now radioactive after the disclosure. Three working weeks to the August recess. Watch whether Republican leadership even schedules floor time.

July 14, June CPI. This is the number that sets the FOMC table. The weak jobs print already cooled rate-hike talk. A soft CPI reading reinforces that and gives Warsh room to soften language. A hot one swings hike odds back up and likely reverses last week's ETF momentum on the spot.

July 28 and 29, FOMC. The Fed decides into a market where positioning is stretched and every basis point of expectation is already traded. Whichever way CPI leans two weeks earlier, this meeting is where it gets priced for real.

This week itself is quieter. No Senate, no Fed, no major data until CPI. That leaves the daily ETF flow prints as the single most direct signal for whether last week's bounce has real sponsorship behind it. We covered the full on-chain backdrop, LTH accumulation, funding rates, and the $53,000 floor in detail in our indicators breakdown from last week.

Our Read Going Into the Week

We are in the setup phase, not the move. The base case is continued chop between $56,000 and $63,800 until the Senate returns and CPI lands.

The on-chain picture has not changed: long-term holders back in accumulation, exchange reserves at multi-year lows, leverage washed out. The fuel is there.

What has changed is the politics. A market structure bill blocked on an ethics clause just collided with the largest presidential crypto disclosure in history. The disclosure does not move price today. But it moves the odds on the biggest regulatory catalyst of the year, and those odds moved in the wrong direction over the weekend. If CLARITY slips past August recess, the market loses its most credible near-term fundamental catalyst and the macro headwinds carry more weight.

Watch the flows Monday through Wednesday. That is the short-term answer. The Senate and the CPI are the medium-term one. Everything else is waiting.


Sources

CNBC: Trump says outside funds run his money after disclosure shows billions in 2025 revenue
CNN: Trump made more than a billion dollars from cryptocurrency ventures in first year back in office
NBC News: Trump's financial disclosure lists $1.4 billion in crypto earnings, powered largely by meme coins
CoinDesk: Bitcoin ETFs see $221 million inflow, ending 10-day outflow streak
24/7 Wall St.: Bitcoin price prediction for July 2026

Disclosure: This article is for informational purposes only and is not financial advice. We may earn commissions from affiliate links. Always do your own research before making investment decisions.
Sunday, July 5, 2026

Most People Have Read the Bitcoin White Paper. Almost Nobody Understood Section 11.

BitBrainers - Bitcoin white paper Section 11 math explained

By BitBrainers Editorial

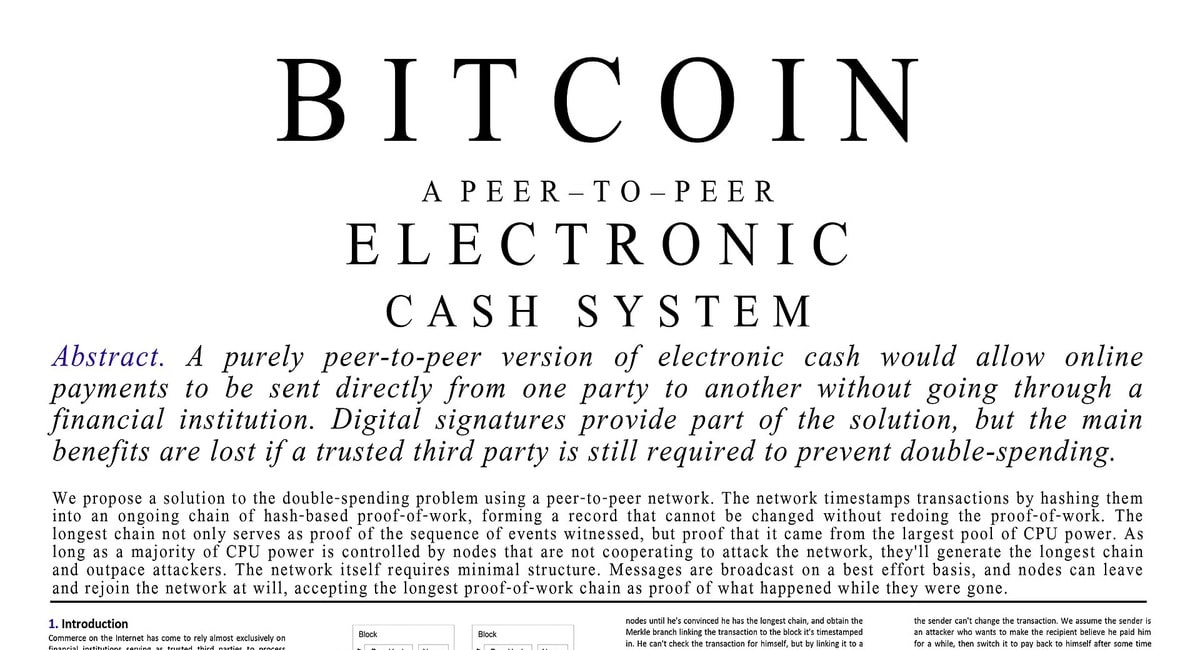
The Bitcoin white paper is nine pages. Most people who claim to have read it understood eight of them. Section 11 is where Nakamoto stops arguing and starts proving. It is also where most readers quietly stopped following the math and decided to trust the conclusion instead.

This is an honest walkthrough of what Section 11 actually says, what problem it solves, and why the answer to that problem is the reason you wait for six confirmations before treating a Bitcoin transaction as final.

What the First Ten Sections Actually Do

Sections one through ten build the argument. Nakamoto describes the problem with double-spending, introduces the concept of a chain of proof-of-work, explains how nodes reach consensus without a central authority, and walks through the incentive structure that keeps miners honest.

It is a compelling design document. Every piece fits logically. But by Section 10, Nakamoto has only argued that the system should work. Section 11 is where he proves it cannot be broken, mathematically, given a specific assumption about the attacker's share of hash power.

The Problem Section 11 Is Solving

Imagine you receive a Bitcoin payment. The sender broadcasts the transaction, it gets included in a block, and the block gets added to the chain. You ship the goods. Then the sender quietly mines an alternative version of the chain that does not include your transaction, catches up to the honest chain, and broadcasts it. Your payment disappears. The sender has their Bitcoin back.

This is the double-spend attack. It is the fundamental threat Nakamoto needed to make practically impossible for the system to work.

The question Section 11 answers is precise: if an attacker controls q percent of the network's total hash power and the honest chain is already z blocks ahead, what is the probability the attacker ever catches up?

The Gambler's Ruin Problem

Nakamoto frames this as a version of the gambler's ruin problem. A gambler with finite resources plays against a casino with infinite resources. Even if the gambler has a near-even chance of winning each hand, the casino will eventually bankrupt them because the casino can absorb losses and the gambler cannot.

In Bitcoin, the honest chain is the casino. It has more hash power than the attacker by assumption, so it mines blocks faster on average. The attacker is the gambler, trying to close the gap against a chain that keeps moving forward.

Nakamoto models the number of blocks the attacker mines using a Poisson distribution. The Poisson distribution is the right tool here because it models the number of times a random event occurs in a fixed interval when that event has a known average rate. Mining a block is exactly that kind of event.

The attacker mines blocks at rate q. The honest chain mines blocks at rate p, where p plus q equals 1 and p is greater than q. For each block the honest chain adds, Nakamoto calculates the probability the attacker closes the gap entirely and overtakes the chain.

What the Formula Produces

BitBrainers - Nakamoto Section 11 attack probability by confirmation

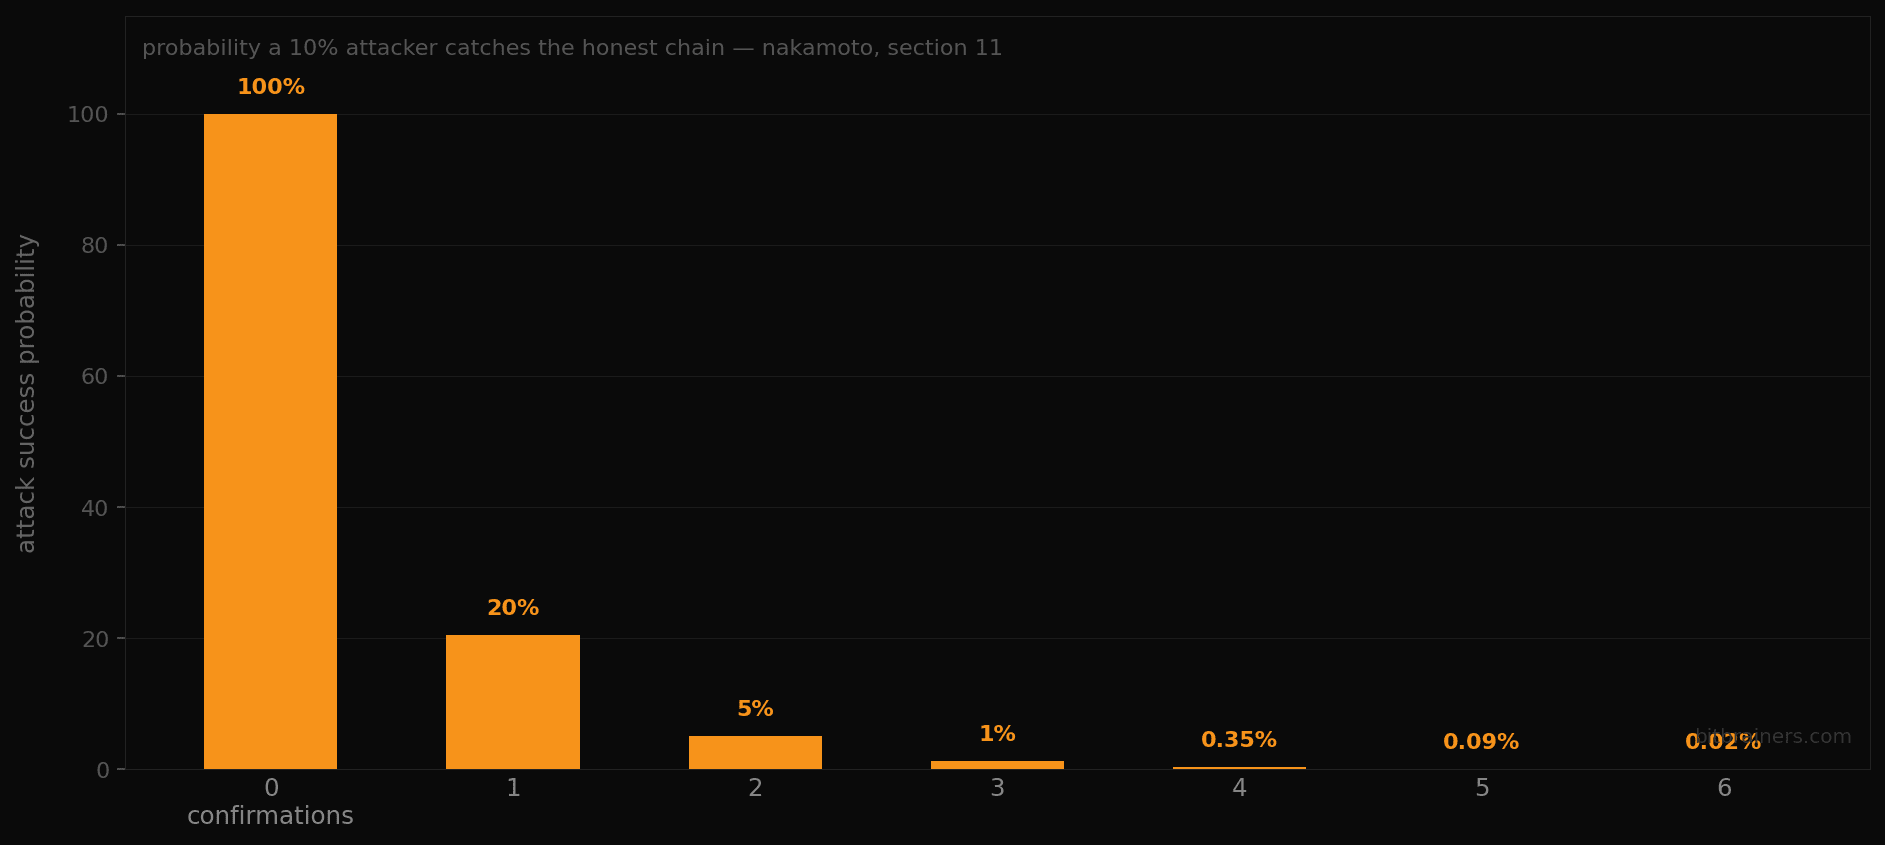
The result is this: the probability the attacker ever catches up from z blocks behind drops exponentially as z increases. Not linearly. Exponentially. Each additional confirmation multiplies the difficulty of a successful attack.

Nakamoto runs the numbers in Section 11 for a specific scenario. If the attacker controls 10 percent of hash power and the recipient waits for 0 confirmations, the attacker succeeds roughly 45 percent of the time. Wait for 1 confirmation and that drops to around 20 percent. At 6 confirmations with a 10 percent attacker, the probability of a successful double-spend is approximately 0.024 percent — two hundredths of one percent.

At 30 percent attacker hash power, the same 6 confirmations holds the probability in the low double digits, around 10 to 12 percent. It is only when the attacker approaches or exceeds 50 percent that the math breaks down fundamentally, because at that point the expected value of the attack becomes positive.

Six confirmations is not an arbitrary convention. It is the point at which the attack probability becomes economically irrational for any attacker controlling a realistic share of hash power.

This also explains why different participants use different thresholds. A merchant accepting a small payment might accept one or two confirmations — the potential loss is too low to justify waiting. An exchange receiving a large transfer might wait for 20 or 30. Six became the industry default because it represents the rational threshold for a realistic attacker, not because Nakamoto mandated it.

Bitcoin basics without the hand-waving.

Every Monday we break down what actually matters in markets and on-chain. No hopium, no noise.

Subscribe Free

Why This Was a Genuine Intellectual Achievement

Nakamoto did not invent the Poisson distribution or the gambler's ruin problem. Both are classical probability theory. What he did was recognize that these tools mapped precisely onto the double-spend problem and apply them correctly in nine pages.

The insight is that you do not need to prevent attacks from being attempted. You only need to make them unprofitable. The math in Section 11 proves that with honest majority hash power, the cost of a successful double-spend attack grows faster than the potential gain as confirmations increase.

That is the security model. Not cryptography alone. Not decentralization alone. A probability calculation that makes cheating economically self-defeating.

What It Means Today

The model holds as long as no single entity controls more than 50 percent of hash power. That assumption has been under pressure as mining has concentrated in large pools. Two or three major pools coordinating would theoretically cross the threshold.

In practice, the economics still work in Bitcoin's favor. A successful 51 percent attack would destroy the value of the asset the attacker spent resources to mine. The incentive to attack is undermined by the attack's own success. Nakamoto noted this too, in Section 6.

But the honest read is that the security guarantee in Section 11 is a probabilistic one, not an absolute one. Six confirmations makes attack economically irrational under normal conditions. It does not make attack physically impossible.

That distinction is what most white paper summaries quietly omit. Nakamoto did not omit it. He put the exact numbers in a table and let the math speak.

The One Line Worth Remembering

Section 11 closes with this: "We can see that the probability drops off exponentially with z."

That sentence is the entire security argument in eleven words. Every six-confirmation standard, every exchange policy, every custody procedure in the industry is downstream of that one observation. Most people who have "read" the white paper read around it.

Now you have not.


Sources

Satoshi Nakamoto: Bitcoin: A Peer-to-Peer Electronic Cash System (2008)
Bitcoin Wiki: Confirmation — security model and confirmation thresholds
Bitcoin Wiki: Double-spending — attack mechanics and historical context

Disclosure: This article is for informational purposes only and is not financial advice. We may earn commissions from affiliate links. Always do your own research before making investment decisions.
Fear and Greed Says Buy. MVRV Says Not Yet. Long-Term Holders Aren't Waiting.

BitBrainers - Bitcoin indicators analysis July 2026

By BitBrainers Editorial

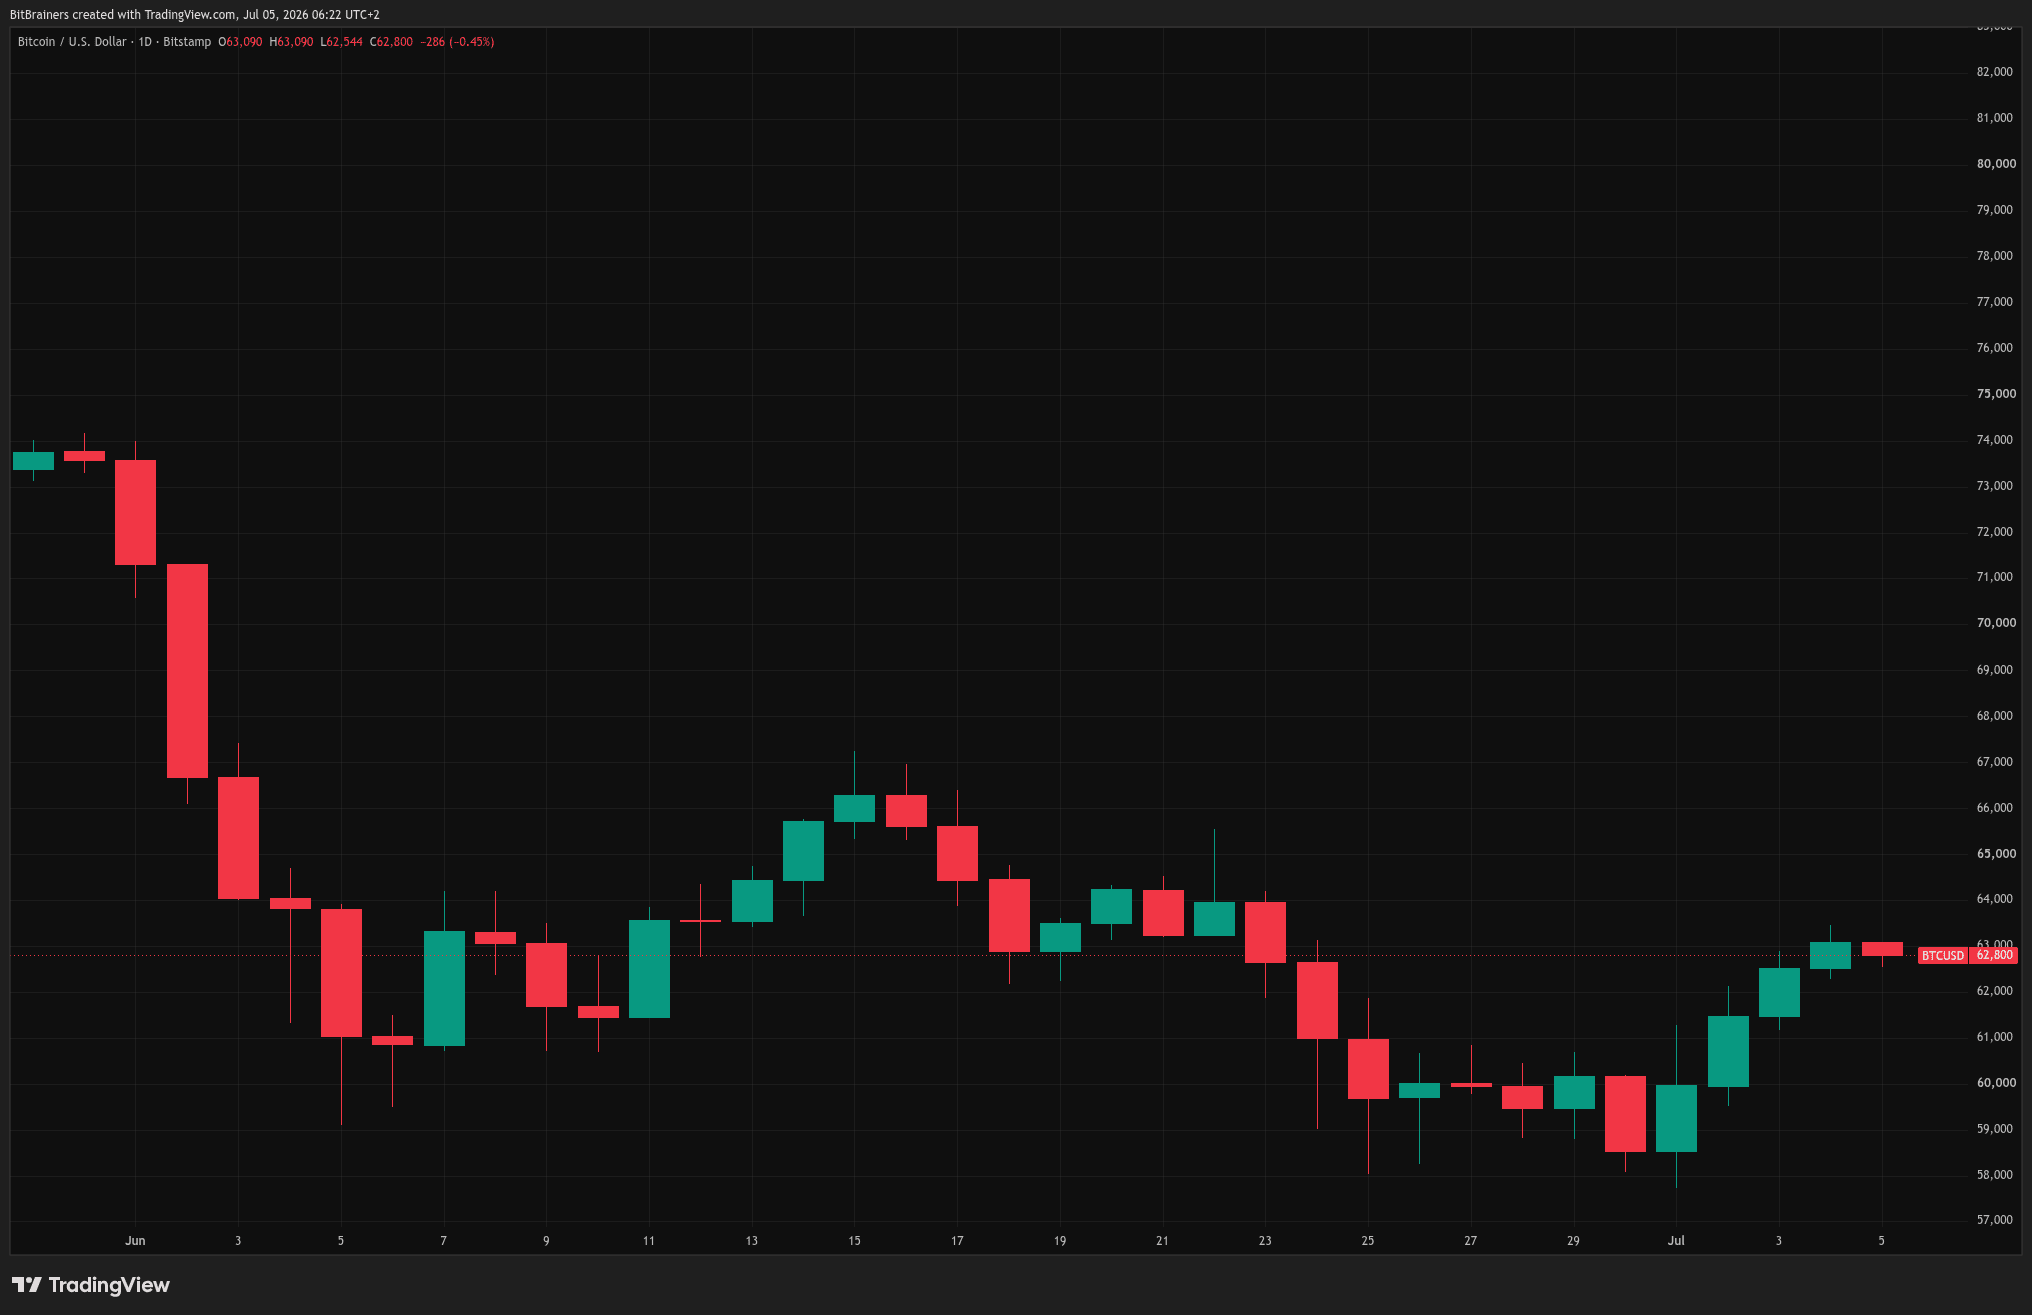
Bitcoin is trading at $62,544 with the Fear and Greed Index at 19. Extreme Fear. In every previous cycle, that reading was one of the cleanest buy signals the market produced. This time, three other indicators are pointing somewhere different. Not down. Not up. Just not yet.

The data is not contradicting itself randomly. Each signal measures a different thing. Working through the disagreement produces a clearer picture than any single number alone.

What Fear and Greed Is Actually Measuring

Extreme Fear at 19 measures sentiment, not structure. It tells you how people feel, not what they own or what price they paid.

In 2022 and 2023, Extreme Fear readings corresponded to retail capitulation. Emotional sellers drove the price down, and the recovery came from the same retail base buying back in at lower levels.

This cycle is structurally different. A significant portion of the selling is coming from ETF redemptions. That is a mechanical process, not an emotional one. When an ETF investor redeems, the fund sells Bitcoin to meet that redemption regardless of how fearful or confident anyone feels.

The Fear and Greed signal assumes a seller who might change their mind. ETF redemptions do not reverse on sentiment alone. That is why the index is at 19 while the outflow streak ran for ten consecutive days before finally breaking this week.

Why MVRV Says the Bottom Is Not Confirmed

The MVRV Z-Score sits at 0.20 as of July 1. Bitcoin is trading near its aggregate realized value. That sounds neutral, and it roughly is.

The issue is that previous confirmed cycle bottoms did not stop at neutral. The Z-Score went negative in November 2022 and briefly negative again in early 2023. Negative MVRV means the average market participant is underwater. That is the level where forced sellers exhaust themselves.

At 0.20, that level has not been reached. The NUPL reading at 0.12 confirms the same picture from a different angle: the network holds minimal unrealized profit, but it has not flipped to aggregate loss.

Neither reading is screaming danger. Neither is screaming bottom.

The Number That Matters More Than $60K

The aggregate realized price, the average acquisition cost of all circulating Bitcoin supply, sits around $53,000. That is roughly 15% below current spot.

As long as Bitcoin trades above $53,000, the network in aggregate is in profit. Drop through that level and the entire post-2020 Bitcoin market goes underwater. That is the structural capitulation line. Not $58,000. Not $60,000. $53,000.

Bitfinex described the realized price hold as "the strongest structural argument the bull case has," adding it is "support only till the mechanical sellers allow it to be." Bitcoin is currently 15% above it. That is margin, not safety.

One clarification worth making: briefly dipping below $53,000 and recovering is not automatically a death sentence. Previous cycles have seen the realized price tested and then held as a launchpad. What would confirm a deeper problem is a sustained break with continued ETF outflows and no LTH response. A wick below followed by a bounce is a different story than a weekly close through it.

We covered the ETF mechanics in more detail in our breakdown of the jobs data bounce and the first ETF inflow of the week.

The signals are splitting. We track what they mean.

One macro read every Monday, the key levels, the data that matters. Zero filter.

Subscribe Free

What Long-Term Holders Are Actually Doing

Here is where the picture gets genuinely interesting. Long-term holders, defined as wallets holding Bitcoin for at least 155 days, flipped from net distribution back to net accumulation in late June, according to Glassnode's Week 26 on-chain report.

LTH supply hit a record 16.3 million BTC. Exchange reserves dropped to a seven-year low of 2.21 million BTC. Coins are leaving exchanges and moving into longer-term storage while the market panics.

The cohorts leading the buying are smaller and mid-sized wallets, 100 to 1,000 BTC, not the largest whale addresses. Glassnode described this as "accumulation beneath the surface," and was careful to note it is too early to call a full accumulation regime. Early accumulation signals have failed before when macro conditions deteriorated faster than on-chain data could capture. That caveat is real. But the directional shift is on-chain, not a survey or a sentiment reading, and that distinction matters.

The Short Squeeze Nobody Is Talking About

Funding rates on perpetual futures hit their most negative reading in three years this week. Negative funding means leveraged traders are paying a premium to maintain short positions. They are betting against Bitcoin at a record rate, and this has persisted for weeks without the price break they are positioned for.

LTH accumulation plus record short positioning is a classic setup for a squeeze. The question is what provides the catalyst. Two candidates sit directly ahead: the Senate returns July 13 to resume CLARITY Act negotiations, and the FOMC meets July 28 and 29. Either event, if it lands on the soft side, hits a market where the short book is extremely crowded.

That is not a price prediction. It is a description of the fuel and the potential ignition points.

What Decides This

On Thursday July 3, Bitcoin ETFs pulled in $221.7 million, their largest single-day inflow in two months, ending the ten-day outflow streak. Fidelity's FBTC led with nearly $166 million. Year-to-date net outflows still sit around $5.4 billion, so one day does not reverse the picture. But the streak ending is not nothing.

The indicators are not disagreeing about Bitcoin's long-term thesis. They are disagreeing about timing. Long-term holders are buying now. MVRV says the structural reset is not complete. The realized price at $53,000 gives the bull case a concrete floor to defend. The short book is loaded for a squeeze that needs a spark.

If ETF inflows stabilize and the Senate produces visible progress on CLARITY before the August recess, the setup changes fast. If Warsh delivers another hawkish surprise at the July 28 FOMC and outflows resume, $53,000 stops being a margin and starts being the number on everyone's screen.

The most honest synthesis across all four signals is this: the data looks more like a mid-cycle correction than a full bear market bottom. Bear market bottoms require MVRV to go deeply negative, widespread LTH distribution, and exchange reserves rising as holders give up. None of those are present. What is present is a sentiment washout, mechanical ETF selling, and conviction buyers stepping in quietly underneath.

Mid-cycle corrections end. They just rarely end on a schedule. Right now Bitcoin has the right ingredients for both outcomes. That is what four indicators in disagreement actually looks like.


Sources

CoinDesk: Bitcoin long-term holders have returned to accumulation, Glassnode says
CoinDesk: $221 million flow into Bitcoin ETFs ending a painful 10-day outflow streak
The Block: Accumulation beneath the surface: Bitcoin rebounds above $61,000
AhaSignals: Bitcoin MVRV Z-Score and NUPL readings, July 1, 2026
24/7 Wall St.: Bitcoin Price Prediction for July 2026
FXStreet: Bitcoin long-term holders resume accumulation as ETF outflows keep institutional sentiment subdued

Disclosure: This article is for informational purposes only and is not financial advice. We may earn commissions from affiliate links. Always do your own research before making investment decisions.
Saturday, July 4, 2026

Washington Promised Crypto a July 4 Signing. Bitcoin Is Still Waiting at $62K.

BitBrainers - CLARITY Act missed July 4 deadline

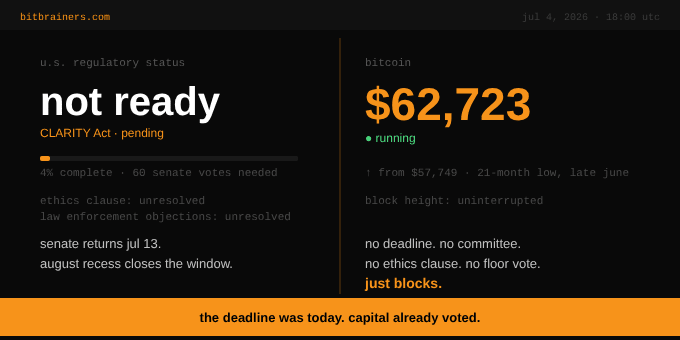
In early May, the White House's top digital assets adviser stood on stage at Consensus Miami and named a date. July 4. The CLARITY Act signed into law as, in his words, a birthday present for America's 250th.

Today is July 4. There is no bill on the president's desk. There is no scheduled floor vote. The Senate is not even in session, and it does not return until July 13.

Bitcoin is trading around $62,700. That number and this missed deadline are more connected than they look.

What Actually Happened to the Deadline

The bill made real progress. The Senate Banking Committee passed it 15 to 9 on May 14, with two Democrats joining every Republican. On June 1 it was placed on the Senate Legislative Calendar, formally eligible for a floor vote.

Then the process hit the wall it was always going to hit. Bipartisan negotiations over ethics provisions broke down in June. The sticking point is a rule barring government officials from holding personal stakes in the crypto industry.

Senate Democrats treat that provision as non-negotiable. The White House has said it will accept rules that apply to everyone but will reject anything targeting one officeholder. Read between those two positions and the problem is obvious. The ethics clause is about the president's own crypto interests, and neither side can say so plainly and still cut a deal.

A second dispute over law enforcement objections to the bill's blockchain developer protections opened a parallel front. Two unresolved fights, one shrinking calendar.

What the CLARITY Act would actually deliver is straightforward. The CFTC gets clear jurisdiction over digital commodity spot markets, the SEC stays focused on securities and investment contracts, and for the first time there is a written framework for DeFi platforms and developer liability. That is the framework that removes the enforcement ambiguity keeping traditional finance cautious about sizing up crypto exposure.

The Math That Decides It

The bill needs 60 votes on the Senate floor. Republicans hold 53. That means at least seven Democrats have to cross over, and the two who voted yes in committee both said their floor votes are not guaranteed.

The calendar is the other constraint. The Senate returns July 13 and breaks for August recess a few weeks later. Policy analysts at Stifel put it bluntly: if the bill does not clear the Senate before that recess, its prospects deteriorate materially.

After August, every senator's attention shifts to the November midterms. The bill also still has to be reconciled with a separate Senate Agriculture Committee version and then merged with the House text that passed back in July 2025. None of that is fast.

Deadlines slip. Our Monday Brief doesn't.

One macro read every Monday, the levels that matter, zero hopium.

Subscribe Free

What the Vacuum Costs, in Numbers

This is where the missed deadline stops being a Washington story and becomes a price story.

Citi cut its 12-month Bitcoin target to $82,000 from $112,000, citing slow progress on US crypto legislation alongside ETF outflows and weak investor interest. That is a $30,000 haircut on a major bank's target, with regulatory delay written explicitly into the rationale.

The ETF picture makes the same point from the flow side. US spot Bitcoin ETFs posted roughly $4.5 billion in net outflows in June, their worst month on record. Institutions that were supposed to be the patient money spent six consecutive weeks heading for the exit.

Part of that is macro. The Fed held rates in June and dropped its easing language, and that repricing hit everything risky. We covered the flow mechanics in our breakdown of this week's bounce on weak jobs data and the first real ETF inflow.

But part of it is exactly what the CLARITY Act was supposed to fix. Institutional allocators do not size up positions in an asset class whose basic regulatory boundaries are still being negotiated. Every month the bill slips, that capital stays parked.

Where That Leaves the Chart

Bitcoin printed a 21-month low near $57,750 in late June and has since clawed back to the $62,000 to $63,000 area. The bounce is real but thin. It arrived on soft jobs data and one day of ETF inflows, not on any structural change.

The structural change was supposed to be today. It did not come.

That leaves two dates carrying the weight for July. The Senate's return on July 13, which starts the three-week window where the CLARITY Act either moves or effectively dies for the year. And the Fed meeting on July 28 and 29, where the market finds out whether the June hawkish turn was a one-off or the new baseline.

The Honest Read

The CLARITY Act is not dead. Senator Hagerty's base case still has a floor vote landing after July 13. A passage before the August recess would be a real catalyst, one the market is currently pricing at close to zero.

But we watch what capital does, not what politicians promise. A deadline the White House set publicly, with five months of runway, just passed with the Senate out of town. Citi did not wait to find out how the ethics fight resolves before cutting its target. The ETF money did not wait either.

If the bill slips past August, expect the analyst downgrades to continue and expect regulatory clarity to become a 2027 story. At $62,700 with no framework, that risk premium stays embedded in the price.

The next two to three weeks after July 13 will matter more than July 4 ever did. Capital is already voting with its feet.


Sources

CoinDesk: White House targets July 4 for Clarity Act passage, says crypto adviser Patrick Witt
CNBC: Crypto industry scores win as Clarity Act regulation bill clears Senate hurdle
The Crypto Times: Bitcoin Price Prediction July 2026: Will BTC Go Up or Crash?
CCN / Yahoo Finance: Senate's Last-Ditch CLARITY Act Talks Could Decide Crypto's Fate for the Rest of the Decade
24/7 Wall St.: Bitcoin Price Prediction for July 2026

Disclosure: This article is for informational purposes only and is not financial advice. We may earn commissions from affiliate links. Always do your own research before making investment decisions.
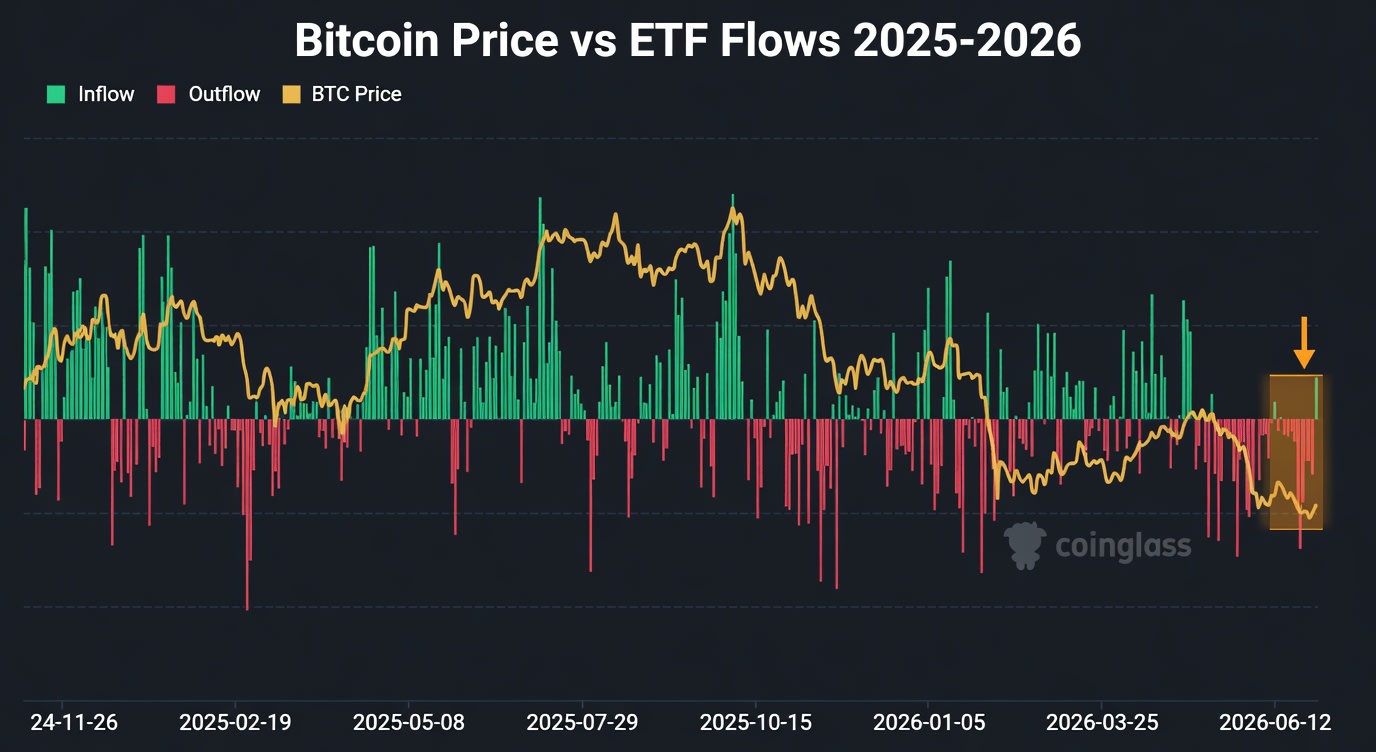
Bitcoin Bounce on Weak Jobs + ETF Inflow: Real Reversal or Relief Rally?

BitBrainers - Bitcoin Price vs ETF Flows June-July 2026

By BitBrainers Editorial

Bitcoin printed a 21-month low near $57,735 on July 1. Three days later it trades above $62,000, a bounce of roughly 8.5 percent, and the timeline has already decided it was the bottom. Two genuinely new data points arrived this week, and both are real. Whether they add up to a reversal is a different question, and the gap between those two things is where most traders lose money.

What the Jobs Report Actually Said

Nonfarm payrolls rose just 57,000 in June, well below the roughly 110,000 to 115,000 consensus. The miss did not land on a strong trend either.

May was revised down to 129,000 and April to 148,000, removing 74,000 jobs from the prior two months combined. Three months ago this labor market was printing upside surprises. It is now decelerating, with revisions pointing the same direction.

The headline unemployment rate fell to 4.2 percent, and that number is doing a lot of misleading work in the coverage. The rate fell because labor force participation dropped 0.3 points to 61.5 percent, its lowest level since March 2021.

The household survey counted 507,000 fewer people employed in June. Unemployment did not fall because more people found work. It fell because people stopped being counted.

Markets read the report as dovish anyway, and for rate expectations that reading is correct. A labor market this soft gives the Fed no case for a hike. But dovish-because-weak is not the same fuel as dovish-because-healthy, and the difference matters for how far any risk rally can run.

One Green Day in the ETF Data

The second catalyst came from the flow side. US spot Bitcoin ETFs recorded a net inflow of roughly $221 million on July 3, the first positive day after ten straight sessions of outflows.

The context makes it notable. June closed as the worst month in the products' history, with net outflows of roughly $4.0 to $4.5 billion depending on the data provider, surpassing the previous record of $3.56 billion set in February 2025. Outflows hit on 19 of 22 trading days.

Against that backdrop, one green day is a crack in the story, and cracks are how reversals start. They are also how relief rallies start, which is why the mechanics of the bounce deserve a look.

As price reclaimed $62,000, roughly $130 million in short positions were liquidated in a single 24-hour window against about $50 million in longs. A meaningful share of this move is forced covering, shorts buying because they had to, not fresh demand buying because it wanted to.

That does not invalidate the bounce. It does mean some of the fuel burns once and does not reload.

Numbers checked. Narratives questioned.

The Macro brief that reads the data before the hype.

Subscribe Free

On paper, the combination looks compelling: a dovish jobs surprise, the first crack of green in ETF flows after record outflows, forced short covering, and upcoming regulatory and central bank events. That narrative deserves scrutiny. The alignment is partial and conditional, not definitive.

The Spread Is the Information

The honest takeaway is the width of the plausible range. Near-term relief is reasonable.

A sustained reversal needs sustained ETF inflows, labor data that does not deteriorate further, constructive regulatory signaling, and a non-disruptive FOMC. That multi-thousand-dollar uncertainty band is not analytical failure. It is a direct measurement of how little decisive structure exists right now.

Two Dates Decide Whether This Was a Bottom

The confirmation test is mechanical, not emotional. Flow-following desks typically want three to five consecutive positive ETF flow days, at volumes above the recent outflow average, before treating a bounce as a regime change.

One green day after ten red ones does not clear that bar. Neither does a rally where short liquidations outran long liquidations by better than two to one.

The calendar does the rest. On July 17 the House Financial Services Committee takes up the CLARITY Act, the first regulatory catalyst with a date attached since the June selloff began.

Then the FOMC meets July 28 and 29. Warsh has dropped the old habit of telegraphing moves in advance, and there is no fresh projection material until September, so markets walk into that meeting with less guidance than at any point in his tenure. A hold likely extends the relief. A hawkish surprise tests the July 1 low.

Until then, the discipline is the same one that applies in every low-structure environment. Confirmation before conviction, mechanism before narrative, and the same suspicion for data that agrees with your position as for data that contradicts it. We covered the flow side of this setup in our July 1 breakdown of why the ETF data matters more than the price.

Sources: U.S. Bureau of Labor Statistics Employment Situation, June 2026, Farside Investors Bitcoin ETF Flow Data, SoSoValue ETF Dashboard, CoinGlass ETF and Liquidation Data, House Financial Services Committee schedule.

Disclosure: This is analysis, not financial advice. We hold BTC. Do your own research before making investment decisions.

The Fed Meets Tomorrow. Bitcoin Is Watching the Wrong Number.

By BitBrainers Editorial Tomorrow at 2pm ET, the Federal Reserve announces whether the fed funds rate holds at 3.50 to 3.75 percent o...

The Fed Meets Tomorrow. Bitcoin Is Watching the Wrong Number.