₿ BTC Loading... via Binance

Sunday, July 5, 2026

Fear and Greed Says Buy. MVRV Says Not Yet. Long-Term Holders Aren't Waiting.

BitBrainers - Bitcoin indicators analysis July 2026

By BitBrainers Editorial

Bitcoin is trading at $62,544 with the Fear and Greed Index at 19. Extreme Fear. In every previous cycle, that reading was one of the cleanest buy signals the market produced. This time, three other indicators are pointing somewhere different. Not down. Not up. Just not yet.

The data is not contradicting itself randomly. Each signal measures a different thing. Working through the disagreement produces a clearer picture than any single number alone.

What Fear and Greed Is Actually Measuring

Extreme Fear at 19 measures sentiment, not structure. It tells you how people feel, not what they own or what price they paid.

In 2022 and 2023, Extreme Fear readings corresponded to retail capitulation. Emotional sellers drove the price down, and the recovery came from the same retail base buying back in at lower levels.

This cycle is structurally different. A significant portion of the selling is coming from ETF redemptions. That is a mechanical process, not an emotional one. When an ETF investor redeems, the fund sells Bitcoin to meet that redemption regardless of how fearful or confident anyone feels.

The Fear and Greed signal assumes a seller who might change their mind. ETF redemptions do not reverse on sentiment alone. That is why the index is at 19 while the outflow streak ran for ten consecutive days before finally breaking this week.

Why MVRV Says the Bottom Is Not Confirmed

The MVRV Z-Score sits at 0.20 as of July 1. Bitcoin is trading near its aggregate realized value. That sounds neutral, and it roughly is.

The issue is that previous confirmed cycle bottoms did not stop at neutral. The Z-Score went negative in November 2022 and briefly negative again in early 2023. Negative MVRV means the average market participant is underwater. That is the level where forced sellers exhaust themselves.

At 0.20, that level has not been reached. The NUPL reading at 0.12 confirms the same picture from a different angle: the network holds minimal unrealized profit, but it has not flipped to aggregate loss.

Neither reading is screaming danger. Neither is screaming bottom.

The Number That Matters More Than $60K

The aggregate realized price, the average acquisition cost of all circulating Bitcoin supply, sits around $53,000. That is roughly 15% below current spot.

As long as Bitcoin trades above $53,000, the network in aggregate is in profit. Drop through that level and the entire post-2020 Bitcoin market goes underwater. That is the structural capitulation line. Not $58,000. Not $60,000. $53,000.

Bitfinex described the realized price hold as "the strongest structural argument the bull case has," adding it is "support only till the mechanical sellers allow it to be." Bitcoin is currently 15% above it. That is margin, not safety.

One clarification worth making: briefly dipping below $53,000 and recovering is not automatically a death sentence. Previous cycles have seen the realized price tested and then held as a launchpad. What would confirm a deeper problem is a sustained break with continued ETF outflows and no LTH response. A wick below followed by a bounce is a different story than a weekly close through it.

We covered the ETF mechanics in more detail in our breakdown of the jobs data bounce and the first ETF inflow of the week.

The signals are splitting. We track what they mean.

One macro read every Monday, the key levels, the data that matters. Zero filter.

Subscribe Free

What Long-Term Holders Are Actually Doing

Here is where the picture gets genuinely interesting. Long-term holders, defined as wallets holding Bitcoin for at least 155 days, flipped from net distribution back to net accumulation in late June, according to Glassnode's Week 26 on-chain report.

LTH supply hit a record 16.3 million BTC. Exchange reserves dropped to a seven-year low of 2.21 million BTC. Coins are leaving exchanges and moving into longer-term storage while the market panics.

The cohorts leading the buying are smaller and mid-sized wallets, 100 to 1,000 BTC, not the largest whale addresses. Glassnode described this as "accumulation beneath the surface," and was careful to note it is too early to call a full accumulation regime. Early accumulation signals have failed before when macro conditions deteriorated faster than on-chain data could capture. That caveat is real. But the directional shift is on-chain, not a survey or a sentiment reading, and that distinction matters.

The Short Squeeze Nobody Is Talking About

Funding rates on perpetual futures hit their most negative reading in three years this week. Negative funding means leveraged traders are paying a premium to maintain short positions. They are betting against Bitcoin at a record rate, and this has persisted for weeks without the price break they are positioned for.

LTH accumulation plus record short positioning is a classic setup for a squeeze. The question is what provides the catalyst. Two candidates sit directly ahead: the Senate returns July 13 to resume CLARITY Act negotiations, and the FOMC meets July 28 and 29. Either event, if it lands on the soft side, hits a market where the short book is extremely crowded.

That is not a price prediction. It is a description of the fuel and the potential ignition points.

What Decides This

On Thursday July 3, Bitcoin ETFs pulled in $221.7 million, their largest single-day inflow in two months, ending the ten-day outflow streak. Fidelity's FBTC led with nearly $166 million. Year-to-date net outflows still sit around $5.4 billion, so one day does not reverse the picture. But the streak ending is not nothing.

The indicators are not disagreeing about Bitcoin's long-term thesis. They are disagreeing about timing. Long-term holders are buying now. MVRV says the structural reset is not complete. The realized price at $53,000 gives the bull case a concrete floor to defend. The short book is loaded for a squeeze that needs a spark.

If ETF inflows stabilize and the Senate produces visible progress on CLARITY before the August recess, the setup changes fast. If Warsh delivers another hawkish surprise at the July 28 FOMC and outflows resume, $53,000 stops being a margin and starts being the number on everyone's screen.

The most honest synthesis across all four signals is this: the data looks more like a mid-cycle correction than a full bear market bottom. Bear market bottoms require MVRV to go deeply negative, widespread LTH distribution, and exchange reserves rising as holders give up. None of those are present. What is present is a sentiment washout, mechanical ETF selling, and conviction buyers stepping in quietly underneath.

Mid-cycle corrections end. They just rarely end on a schedule. Right now Bitcoin has the right ingredients for both outcomes. That is what four indicators in disagreement actually looks like.


Sources

CoinDesk: Bitcoin long-term holders have returned to accumulation, Glassnode says
CoinDesk: $221 million flow into Bitcoin ETFs ending a painful 10-day outflow streak
The Block: Accumulation beneath the surface: Bitcoin rebounds above $61,000
AhaSignals: Bitcoin MVRV Z-Score and NUPL readings, July 1, 2026
24/7 Wall St.: Bitcoin Price Prediction for July 2026
FXStreet: Bitcoin long-term holders resume accumulation as ETF outflows keep institutional sentiment subdued

Disclosure: This article is for informational purposes only and is not financial advice. We may earn commissions from affiliate links. Always do your own research before making investment decisions.
Saturday, July 4, 2026

Washington Promised Crypto a July 4 Signing. Bitcoin Is Still Waiting at $62K.

BitBrainers - CLARITY Act missed July 4 deadline

In early May, the White House's top digital assets adviser stood on stage at Consensus Miami and named a date. July 4. The CLARITY Act signed into law as, in his words, a birthday present for America's 250th.

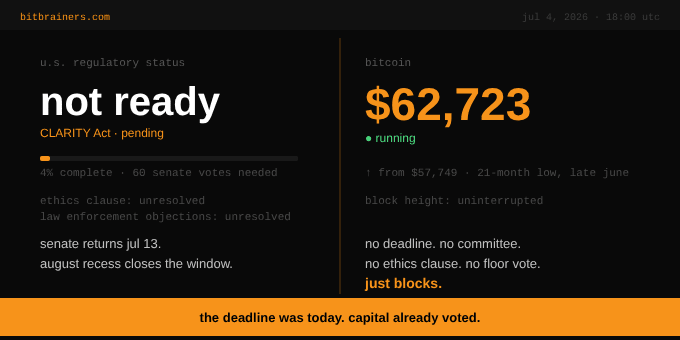
Today is July 4. There is no bill on the president's desk. There is no scheduled floor vote. The Senate is not even in session, and it does not return until July 13.

Bitcoin is trading around $62,700. That number and this missed deadline are more connected than they look.

What Actually Happened to the Deadline

The bill made real progress. The Senate Banking Committee passed it 15 to 9 on May 14, with two Democrats joining every Republican. On June 1 it was placed on the Senate Legislative Calendar, formally eligible for a floor vote.

Then the process hit the wall it was always going to hit. Bipartisan negotiations over ethics provisions broke down in June. The sticking point is a rule barring government officials from holding personal stakes in the crypto industry.

Senate Democrats treat that provision as non-negotiable. The White House has said it will accept rules that apply to everyone but will reject anything targeting one officeholder. Read between those two positions and the problem is obvious. The ethics clause is about the president's own crypto interests, and neither side can say so plainly and still cut a deal.

A second dispute over law enforcement objections to the bill's blockchain developer protections opened a parallel front. Two unresolved fights, one shrinking calendar.

What the CLARITY Act would actually deliver is straightforward. The CFTC gets clear jurisdiction over digital commodity spot markets, the SEC stays focused on securities and investment contracts, and for the first time there is a written framework for DeFi platforms and developer liability. That is the framework that removes the enforcement ambiguity keeping traditional finance cautious about sizing up crypto exposure.

The Math That Decides It

The bill needs 60 votes on the Senate floor. Republicans hold 53. That means at least seven Democrats have to cross over, and the two who voted yes in committee both said their floor votes are not guaranteed.

The calendar is the other constraint. The Senate returns July 13 and breaks for August recess a few weeks later. Policy analysts at Stifel put it bluntly: if the bill does not clear the Senate before that recess, its prospects deteriorate materially.

After August, every senator's attention shifts to the November midterms. The bill also still has to be reconciled with a separate Senate Agriculture Committee version and then merged with the House text that passed back in July 2025. None of that is fast.

Deadlines slip. Our Monday Brief doesn't.

One macro read every Monday, the levels that matter, zero hopium.

Subscribe Free

What the Vacuum Costs, in Numbers

This is where the missed deadline stops being a Washington story and becomes a price story.

Citi cut its 12-month Bitcoin target to $82,000 from $112,000, citing slow progress on US crypto legislation alongside ETF outflows and weak investor interest. That is a $30,000 haircut on a major bank's target, with regulatory delay written explicitly into the rationale.

The ETF picture makes the same point from the flow side. US spot Bitcoin ETFs posted roughly $4.5 billion in net outflows in June, their worst month on record. Institutions that were supposed to be the patient money spent six consecutive weeks heading for the exit.

Part of that is macro. The Fed held rates in June and dropped its easing language, and that repricing hit everything risky. We covered the flow mechanics in our breakdown of this week's bounce on weak jobs data and the first real ETF inflow.

But part of it is exactly what the CLARITY Act was supposed to fix. Institutional allocators do not size up positions in an asset class whose basic regulatory boundaries are still being negotiated. Every month the bill slips, that capital stays parked.

Where That Leaves the Chart

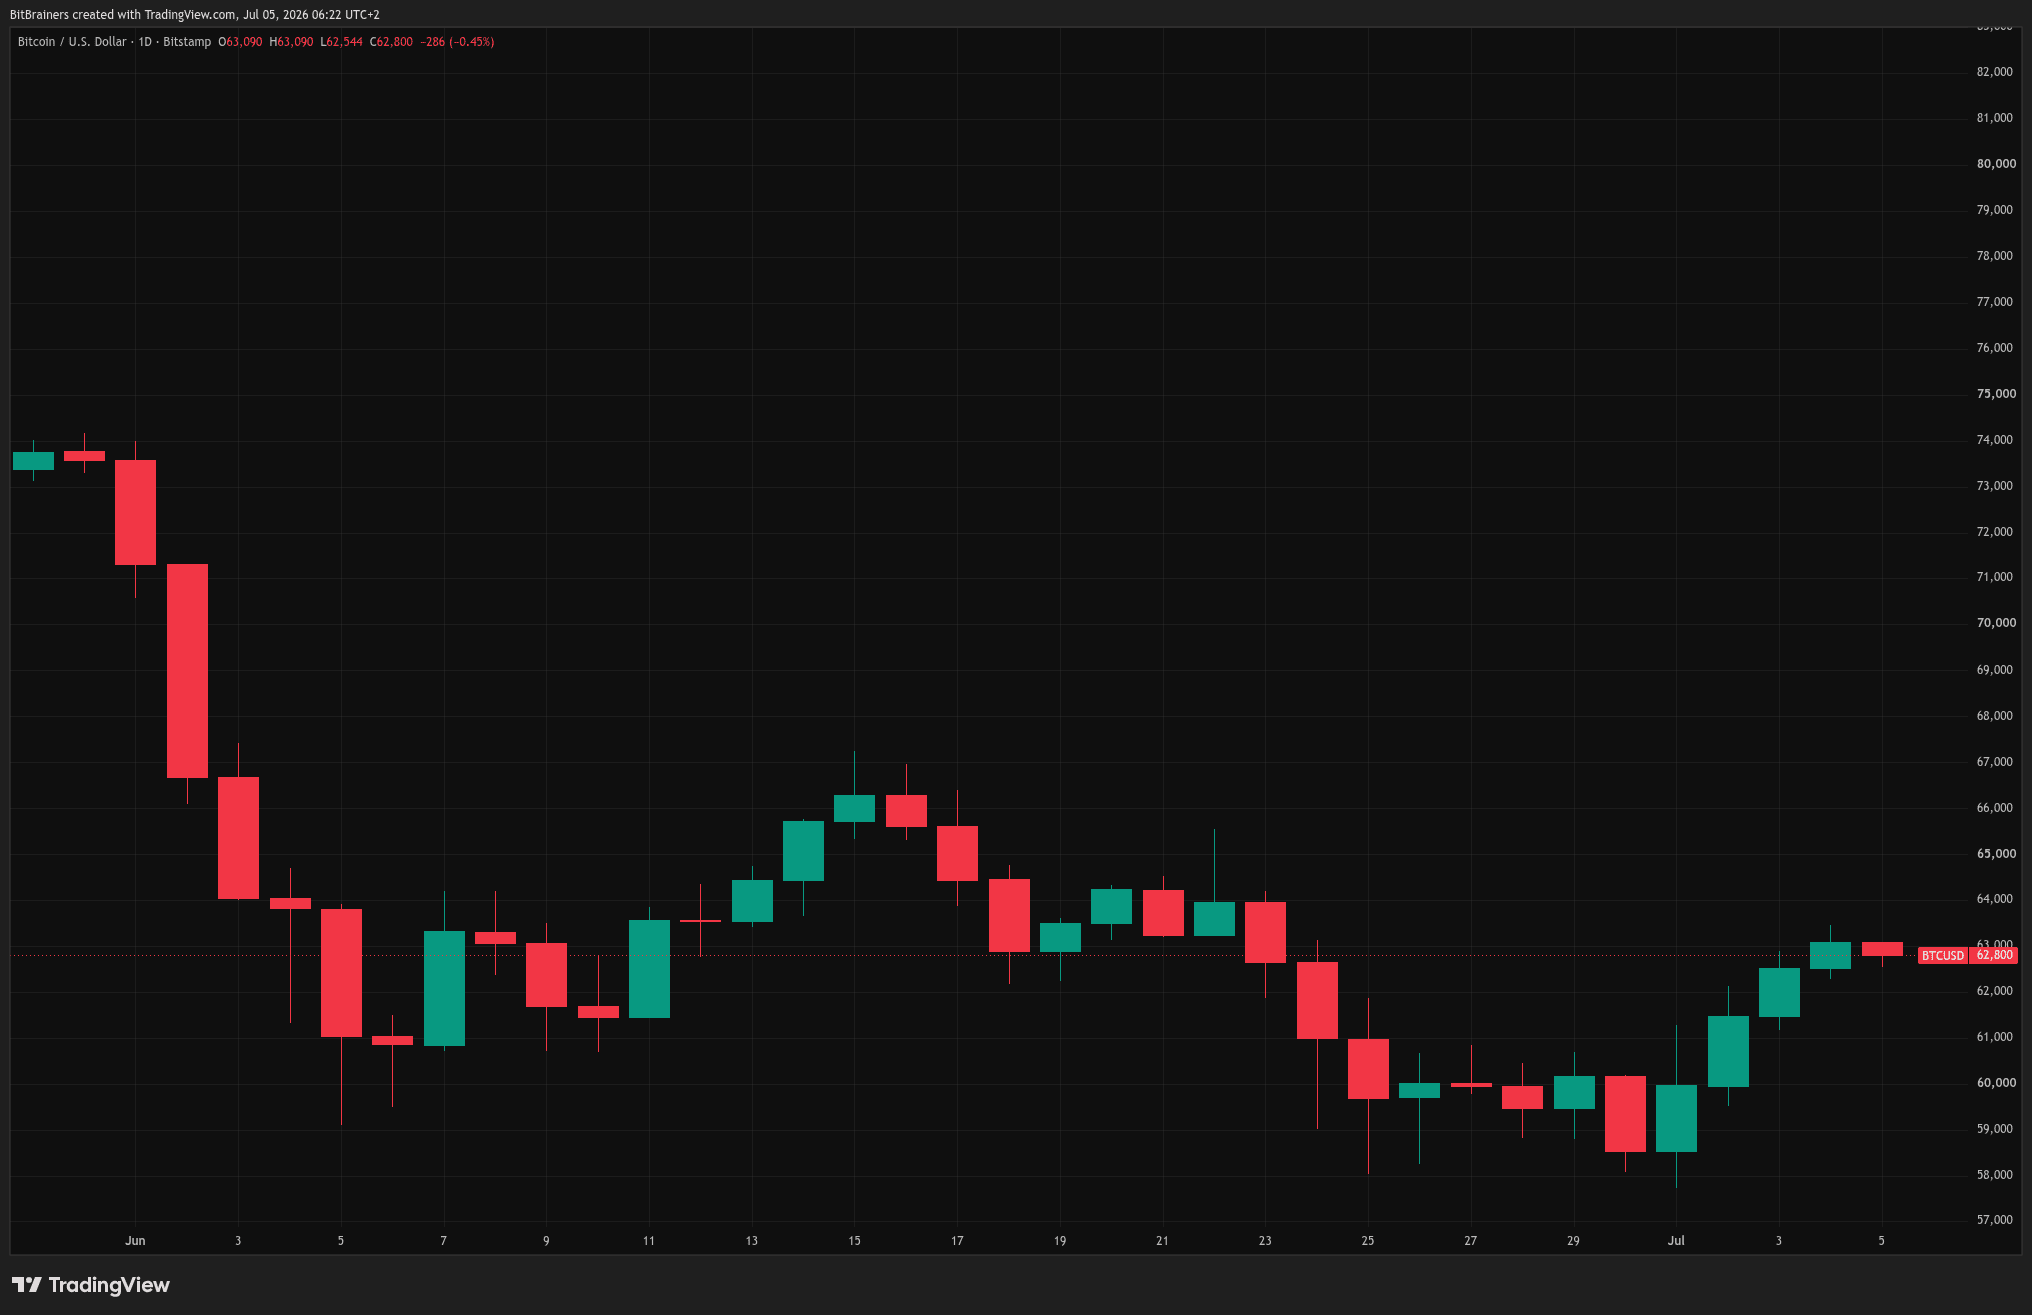
Bitcoin printed a 21-month low near $57,750 in late June and has since clawed back to the $62,000 to $63,000 area. The bounce is real but thin. It arrived on soft jobs data and one day of ETF inflows, not on any structural change.

The structural change was supposed to be today. It did not come.

That leaves two dates carrying the weight for July. The Senate's return on July 13, which starts the three-week window where the CLARITY Act either moves or effectively dies for the year. And the Fed meeting on July 28 and 29, where the market finds out whether the June hawkish turn was a one-off or the new baseline.

The Honest Read

The CLARITY Act is not dead. Senator Hagerty's base case still has a floor vote landing after July 13. A passage before the August recess would be a real catalyst, one the market is currently pricing at close to zero.

But we watch what capital does, not what politicians promise. A deadline the White House set publicly, with five months of runway, just passed with the Senate out of town. Citi did not wait to find out how the ethics fight resolves before cutting its target. The ETF money did not wait either.

If the bill slips past August, expect the analyst downgrades to continue and expect regulatory clarity to become a 2027 story. At $62,700 with no framework, that risk premium stays embedded in the price.

The next two to three weeks after July 13 will matter more than July 4 ever did. Capital is already voting with its feet.


Sources

CoinDesk: White House targets July 4 for Clarity Act passage, says crypto adviser Patrick Witt
CNBC: Crypto industry scores win as Clarity Act regulation bill clears Senate hurdle
The Crypto Times: Bitcoin Price Prediction July 2026: Will BTC Go Up or Crash?
CCN / Yahoo Finance: Senate's Last-Ditch CLARITY Act Talks Could Decide Crypto's Fate for the Rest of the Decade
24/7 Wall St.: Bitcoin Price Prediction for July 2026

Disclosure: This article is for informational purposes only and is not financial advice. We may earn commissions from affiliate links. Always do your own research before making investment decisions.
Bitcoin Bounce on Weak Jobs + ETF Inflow: Real Reversal or Relief Rally?

BitBrainers - Bitcoin Price vs ETF Flows June-July 2026

By BitBrainers Editorial

Bitcoin printed a 21-month low near $57,735 on July 1. Three days later it trades above $62,000, a bounce of roughly 8.5 percent, and the timeline has already decided it was the bottom. Two genuinely new data points arrived this week, and both are real. Whether they add up to a reversal is a different question, and the gap between those two things is where most traders lose money.

What the Jobs Report Actually Said

Nonfarm payrolls rose just 57,000 in June, well below the roughly 110,000 to 115,000 consensus. The miss did not land on a strong trend either.

May was revised down to 129,000 and April to 148,000, removing 74,000 jobs from the prior two months combined. Three months ago this labor market was printing upside surprises. It is now decelerating, with revisions pointing the same direction.

The headline unemployment rate fell to 4.2 percent, and that number is doing a lot of misleading work in the coverage. The rate fell because labor force participation dropped 0.3 points to 61.5 percent, its lowest level since March 2021.

The household survey counted 507,000 fewer people employed in June. Unemployment did not fall because more people found work. It fell because people stopped being counted.

Markets read the report as dovish anyway, and for rate expectations that reading is correct. A labor market this soft gives the Fed no case for a hike. But dovish-because-weak is not the same fuel as dovish-because-healthy, and the difference matters for how far any risk rally can run.

One Green Day in the ETF Data

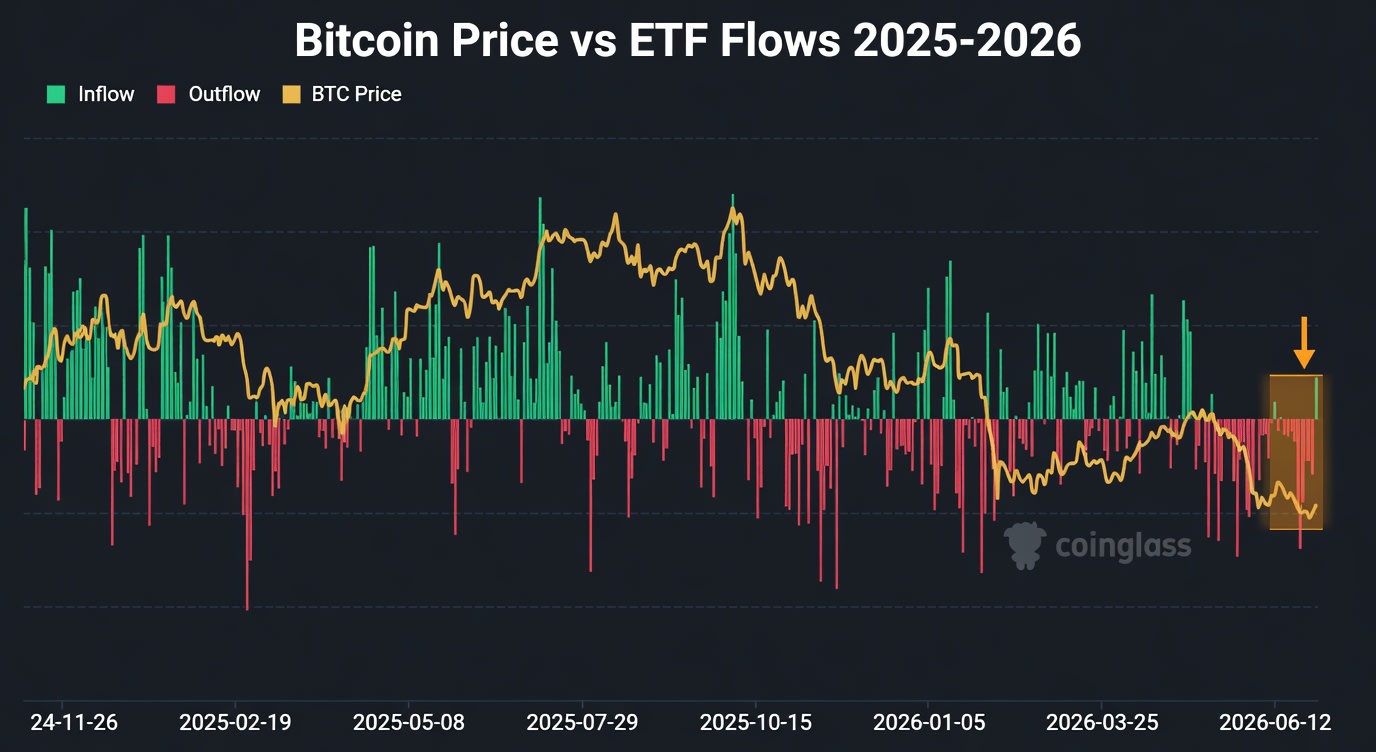
The second catalyst came from the flow side. US spot Bitcoin ETFs recorded a net inflow of roughly $221 million on July 3, the first positive day after ten straight sessions of outflows.

The context makes it notable. June closed as the worst month in the products' history, with net outflows of roughly $4.0 to $4.5 billion depending on the data provider, surpassing the previous record of $3.56 billion set in February 2025. Outflows hit on 19 of 22 trading days.

Against that backdrop, one green day is a crack in the story, and cracks are how reversals start. They are also how relief rallies start, which is why the mechanics of the bounce deserve a look.

As price reclaimed $62,000, roughly $130 million in short positions were liquidated in a single 24-hour window against about $50 million in longs. A meaningful share of this move is forced covering, shorts buying because they had to, not fresh demand buying because it wanted to.

That does not invalidate the bounce. It does mean some of the fuel burns once and does not reload.

Numbers checked. Narratives questioned.

The Macro brief that reads the data before the hype.

Subscribe Free

On paper, the combination looks compelling: a dovish jobs surprise, the first crack of green in ETF flows after record outflows, forced short covering, and upcoming regulatory and central bank events. That narrative deserves scrutiny. The alignment is partial and conditional, not definitive.

The Spread Is the Information

The honest takeaway is the width of the plausible range. Near-term relief is reasonable.

A sustained reversal needs sustained ETF inflows, labor data that does not deteriorate further, constructive regulatory signaling, and a non-disruptive FOMC. That multi-thousand-dollar uncertainty band is not analytical failure. It is a direct measurement of how little decisive structure exists right now.

Two Dates Decide Whether This Was a Bottom

The confirmation test is mechanical, not emotional. Flow-following desks typically want three to five consecutive positive ETF flow days, at volumes above the recent outflow average, before treating a bounce as a regime change.

One green day after ten red ones does not clear that bar. Neither does a rally where short liquidations outran long liquidations by better than two to one.

The calendar does the rest. On July 17 the House Financial Services Committee takes up the CLARITY Act, the first regulatory catalyst with a date attached since the June selloff began.

Then the FOMC meets July 28 and 29. Warsh has dropped the old habit of telegraphing moves in advance, and there is no fresh projection material until September, so markets walk into that meeting with less guidance than at any point in his tenure. A hold likely extends the relief. A hawkish surprise tests the July 1 low.

Until then, the discipline is the same one that applies in every low-structure environment. Confirmation before conviction, mechanism before narrative, and the same suspicion for data that agrees with your position as for data that contradicts it. We covered the flow side of this setup in our July 1 breakdown of why the ETF data matters more than the price.

Sources: U.S. Bureau of Labor Statistics Employment Situation, June 2026, Farside Investors Bitcoin ETF Flow Data, SoSoValue ETF Dashboard, CoinGlass ETF and Liquidation Data, House Financial Services Committee schedule.

Disclosure: This is analysis, not financial advice. We hold BTC. Do your own research before making investment decisions.
Friday, July 3, 2026

Five AIs, One Bitcoin Chart, Ten Thousand Dollars of Disagreement

BitBrainers - Five AIs, One Bitcoin Chart, Ten Thousand Dollars of Disagreement

By BitBrainers Editorial

Five of the most advanced AI models on the planet were handed the same Bitcoin chart this week and asked where the price lands on July 31. Their answers span more than ten thousand dollars. Before you screenshot whichever forecast agrees with your position, it is worth understanding what that spread actually measures, because it is not Bitcoin.

The Numbers, Side by Side

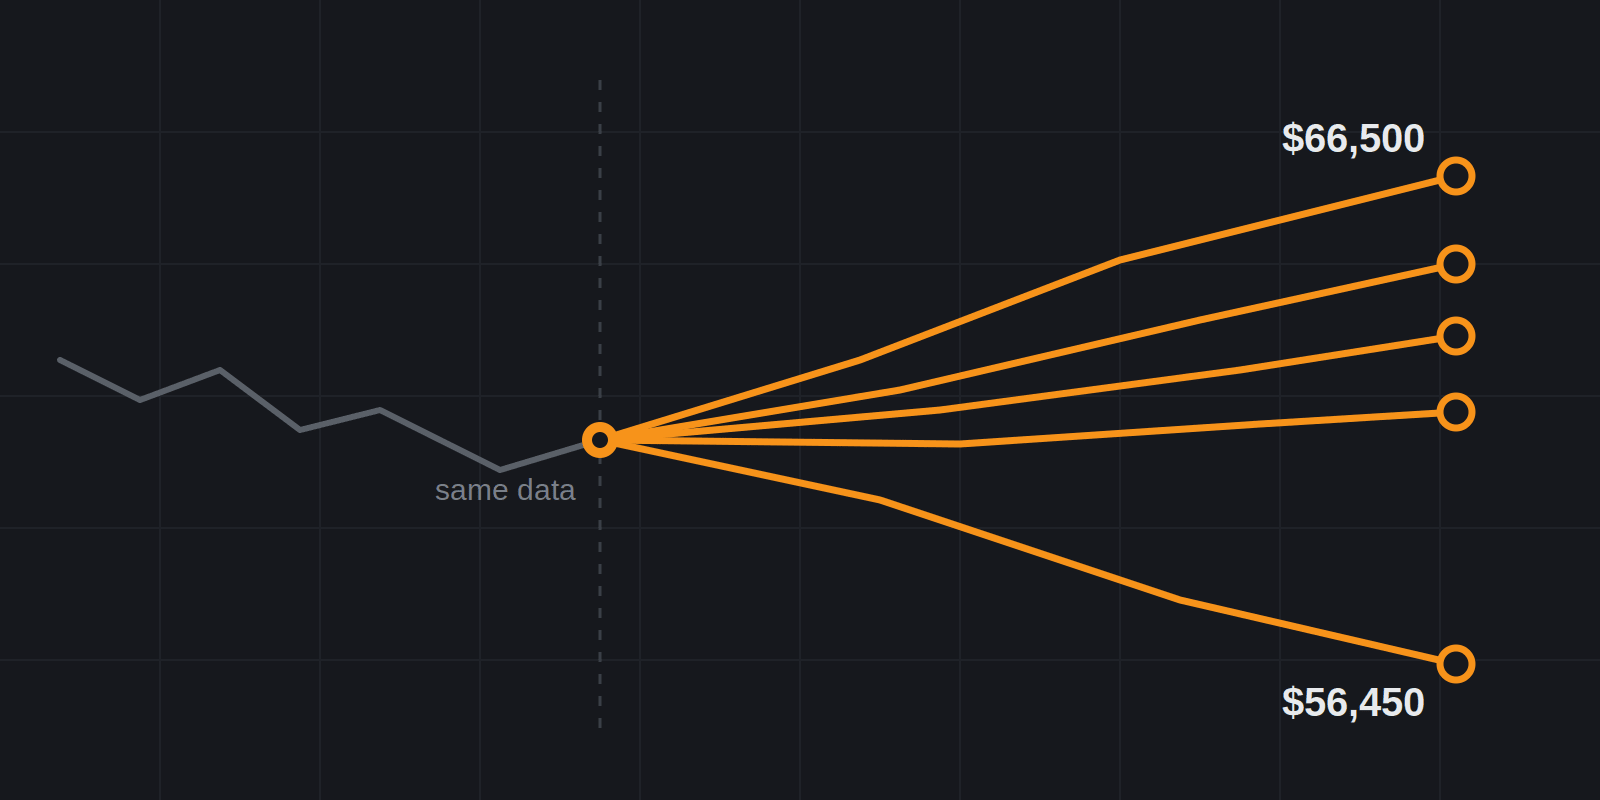
Finbold ran the test with Bitcoin trading around $61,200. Anthropic's Claude came in most bullish, projecting an 8.67 percent climb to $66,500 by month end. OpenAI's ChatGPT-5.2 called a 5.4 percent rally to $64,500. Grok 4.1 landed at $63,501, a 3.77 percent gain. DeepSeek saw an essentially flat month, up 1.31 percent to $62,000. And Gemini 3 Flash broke from the pack entirely, forecasting a 7.76 percent drop to $56,450.

Same price data. Same technical indicators. Same date. One model says Bitcoin gains eight and a half percent, another says it loses nearly eight.

To be fair about the baseline: human analysts produce at least this much dispersion on Bitcoin targets, often more. Citi just cut its 12-month target to $82,000 in the same week other desks are defending six figures. Dispersion is not the AI-specific failure here. The difference is in the delivery. A human strategist wraps the number in scenarios, probabilities, and an implicit admission that this is an educated guess. The models deliver theirs with uniform, unhedged confidence, because sounding authoritative is what they are optimized for. The spread is normal. The false certainty attached to every point in it is the new problem.

A separate and larger experiment last week makes the point harder to dismiss. Bitcoin.com News put the same stripped-down question to 14 AI chatbots, deliberately removing the supporting context so each model had to produce an unbiased forecast across 30-day, 90-day, and year-end horizons. The answers came back as ranges wide enough to be unfalsifiable. One flagship model offered a year-end window of $50,000 to $75,000. Another gave $55,000 to $75,000. A forecast that spans a 50 percent move in either direction is not a forecast. It is a refusal to be wrong dressed up as analysis.


When They Agree, It Gets Worse

The counterintuitive part: model agreement is not more trustworthy than model disagreement. In June, ChatGPT and Claude were separately asked where Bitcoin bottoms by Q4 2026, and their answers landed within $2,500 of each other, $54,500 and $52,000 respectively. That looks like signal. Two independent systems converging on the same zone.

Except they are not independent. Both models were trained on overlapping snapshots of the same internet, both were fed the same public market data, and both leaned on the same widely published frameworks, realized price for one, miner production cost for the other, both of which have been standard crypto-analyst furniture for years. Even the outlet reporting the convergence flagged the open question of whether it reflects genuine signal or simply shared training data and identical inputs. When two students copy from the same textbook, matching answers tell you about the textbook, not about the exam.

Numbers checked. Narratives questioned.

The Macro brief that reads the data before the hype.

Subscribe Free

We Ran Our Own Version of This Test

Back in June we tested this mechanism directly rather than taking anyone's word for it. We asked several leading models for a Bitcoin allocation recommendation and got the same answer from all of them: a cautious 2 to 15 percent position, dollar-cost averaged in, medium risk. That uniformity is not five systems independently reasoning their way to the same conclusion. It is the answer a compliance-minded advisor is trained to give, the one that never gets anyone sued, reproduced across every model because they were all trained on the same body of careful, liability-aware financial writing.

Then we corrected one model's stale price data and watched its recommended allocation triple, from a 1 to 5 percent range up to 5 to 15 percent, off a single number changing in its context. Nobody managing real money triples position size over one price correction. Whatever produced that jump, it was not conviction. The model latched onto whatever drawdown figure it believed it was looking at and rebuilt its entire answer around it, with full confidence both times.

That is the mechanism under this week's ten thousand dollar spread. These systems do not hold a thesis about Bitcoin that survives from one question to the next. Each answer is generated fresh, shaped by whatever is loudest in the prompt, and delivered with the same fluent certainty whether the underlying reasoning is sturdy or nonexistent. Fluency and correctness are not connected, and price forecasting is where that disconnect is most expensive to ignore.

The Spread Is the Information

None of this means the models are useless. It means the test itself measures the worst way to use them. Short-term crypto moves are driven by things a single chart rarely captures: macro liquidity, ETF flows, whale wallet movements, regulatory headlines, leverage cascades, corporate treasury actions. Pure visual technical analysis is a weak signal in the best of times, so handing a model a chart and asking for a price is asking it to be confident about insufficient input. It will oblige, because a system trained to sound authoritative papers over the gap rather than admitting it.

The stronger configurations exist and almost nobody publishing these forecast pieces uses them: feed the model on-chain data, filings, and news flow together instead of a chart in isolation, give it code execution to build custom indicators rather than eyeballing MACD, or run multiple models against each other in structured debate and study where they break ranks. Used that way, a model is a research multiplier. Used as a chart oracle, it is a random number generator with excellent grammar.

Read properly, this week's forecasts do carry one honest piece of information: the spread itself. Five frontier systems given identical data disagree by more than 16 percent of Bitcoin's price. That is a direct measurement of how little predictive structure exists in the chart right now, published accidentally by the companies most motivated to hide it. The disagreement is the finding.

Meanwhile the thing that actually moved markets this week was not in any model's forecast. It was a mechanical trigger, Strategy's valuation crossing below the value of its own Bitcoin, that had been sitting in an SEC filing since last August. We covered it here: The Premium Died First. The Framework Was Already Written. No chatbot flagged it in advance. It was findable the whole time by anyone reading filings instead of asking for price targets.

How to Read the Next Forecast

Practical rules for the next time an AI price prediction crosses your feed.

  • Check the spread before the number. If the same test produced targets ten thousand dollars apart, any single model's target is noise wearing a suit
  • Treat convergence with the same suspicion as divergence. Models trained on the same data agreeing is expected, not informative
  • Watch what happens when inputs change. An answer that swings hard on one corrected number was never analysis
  • Judge the input before the output. A forecast built on a chart alone was starved of the things that actually move price. Rich input, filings plus flows plus on-chain data, deserves more attention than any chart-only oracle
  • Use the models for what they are built for: reading filings, compressing data, arguing against your position. The July 31 forecasts will be graded in four weeks, and we will check the scores

Sources: Finbold AI predicts Bitcoin price for July 31, 2026, Bitcoin.com News 14 AI Models Including Claude, ChatGPT and Grok Predict Bitcoin's Price Outlook, CCN via Yahoo Finance Can AI Call the Bitcoin Bottom?

Disclosure: This is analysis, not financial advice. We hold BTC. Do your own research before making investment decisions.

The Premium Died First. The Framework Was Already Written.

BitBrainers - The Premium Died First. The Framework Was Already Written.

By BitBrainers Editorial

On June 27, a number on Strategy's own website crossed a line it had never crossed before, and two days later the company that spent four years promising never to sell Bitcoin published a board-approved plan to sell up to $1.25 billion of it. The stock went up on the news, JPMorgan published a warning three days after that, and almost nobody in the coverage connected the two dates, even though Strategy itself filed the script for this exact moment with the SEC back in August 2025.

The Number That Forced It

The metric is enterprise mNAV. It compares Strategy's total enterprise value, meaning market cap plus debt plus preferred stock, against the market value of the 847,363 BTC on its balance sheet. For years that ratio was the whole bull case. At the November 2024 peak it hit 4x, meaning investors paid four dollars for every dollar of Bitcoin the company held, because MSTR was the leveraged BTC vehicle everyone wanted. The premium powered a flywheel: issue stock above the value of the Bitcoin backing it, use the proceeds to buy more Bitcoin, and let the growing stack justify the next issuance.

On June 27, 2026, that ratio closed below 1 for the first time. The market briefly valued the entire company, the software business, the brand, the financial engineering, at less than the coins in the vault. The ratio has since recovered above parity as MSTR rebounded roughly 20 percent after the framework announcement, but the crossing itself did its damage, because below 1 the funding model stops working. Issuing shares below NAV to buy Bitcoin dilutes existing shareholders instead of enriching them, so the accumulation engine that bought $13.7 billion of BTC this year alone could no longer fund itself the old way. Meanwhile the obligations stacked on top of that engine kept running regardless. The company owes roughly $1.7 billion a year in preferred dividends and interest, anchored by its STRC preferred stock, whose rate just went up to 12 percent.


A Script Filed Last August

Here is the part the coverage keeps missing: Strategy told everyone this would happen. An 8-K exhibit filed with the SEC in August 2025 laid out a public playbook tied to mNAV levels. Above 4x, issue stock aggressively to buy Bitcoin. Between 2.5x and 4x, issue opportunistically. Below 1x, consider issuing credit to repurchase MSTR instead. CEO Phong Le went further late last year, saying the company might consider selling Bitcoin if the ratio dropped below 1. And the first crack in the never-sell brand had already appeared in May, when Strategy quietly sold 32 BTC for about $2.5 million to cover dividend obligations, its first sale since 2022.

So when the ratio crossed on a Friday and the framework arrived the following Monday, it was less a reversal than a pre-announced contingency going live.

The June 29 filing, branded the Digital Credit Capital Framework, has five parts: a $2.55 billion dollar reserve dedicated to dividends and interest, a hard floor of 12 months of coverage, the STRC dividend increase to 12 percent, two separate $1 billion buyback authorizations for preferred securities and common stock, and the piece that made headlines, a Bitcoin Monetization Program authorizing sales of up to $1.25 billion. Worth being precise here: this is an authorization, not a sale. The ceiling represents under 2.5 percent of the stack, and as of the filing date no additional Bitcoin had been sold under it.

MSTR jumped 6 to 7 percent in pre-market trading on the news, which sounds backwards until you look at the alternative. With the treasury underwater by roughly $14 billion at the time of the filing against a $75,651 average cost, and a $1.7 billion annual dividend bill, a formal funded mechanism for meeting those obligations beats improvised distress selling from every angle an investor cares about. The rally was relief that the company had a plan, not enthusiasm for the selling.

The market moves fast. We keep the receipts.

One macro brief every Monday. No hopium, no noise.

Subscribe Free

Then JPMorgan Picked Its Target

Three days after the framework, on July 2, JPMorgan analysts led by Nikolaos Panigirtzoglou published a report warning that Strategy's sell authorization introduces avoidable two-way flow risk into the Bitcoin market. Their argument: Strategy bought roughly 70 percent of all net digital asset inflows this year and holds around 4 percent of total BTC supply, so a buyer that size gaining formal authority to sell adds a new source of uncertainty. Their prescription: hold 24 to 36 months of dividend coverage instead of the current 17.4, even if it means issuing equity at a discount.

The concentration point has real substance. A holder of 4 percent of supply gaining sell authority genuinely changes market signaling, whoever the holder is. But the aim is selective, and the numbers show it.

In June, US spot Bitcoin ETFs posted their worst month ever, $4.06 billion in net outflows. BlackRock's IBIT alone accounted for roughly $3.3 billion of it, and the ETF complex mechanically sold an estimated 51,726 BTC over 30 days to meet redemptions. That is realized selling, more than two and a half times Strategy's entire authorized ceiling, executed in a single month. JPMorgan wrote no report about two-way flow risk from the ETF wrapper. The warning went to the Bitcoin-native company with the loud founder rather than to the asset manager whose product did the actual selling.

Context on the messenger matters too. Jamie Dimon called Bitcoin a fraud in 2017, a pet rock in 2024, and told a Senate hearing in 2023 that if he were the government he would close it down. None of that makes his analysts wrong about Strategy's balance sheet, and the balance sheet criticism deserves engagement on its merits. It does mean the framing deserves the same scrutiny the balance sheet gets.


Where We Actually Land

We have watched enough leverage from the desk side to separate two things the coverage keeps merging. The accumulation was never the problem. Building an 847,363 BTC position, 4 percent of everything that will ever exist, is the boldest corporate conviction bet on record, and if you believe Bitcoin survives the decade, that stack is the whole point of the company. We still back that idea, including this week.

The machinery bolted on top is a different animal. Twelve percent perpetual dividends, layered preferred securities, and a funding model that only works while the equity trades at a premium amount to a structure that borrowed against the premium as if it were permanent, and premiums are cyclical by nature. The framework is not Saylor abandoning the thesis. It is the balance sheet adapting to a bear market that refused to honor the financing terms, with enough reserve and flexibility built in that distress is a scenario, not a schedule.

The honest read: the conviction survives, the engineering is on probation, and the largest realized Bitcoin seller last month was the ETF wrapper Wall Street built, not the company Wall Street warned about.

Read also: Bitcoin Doesn't Have a Crypto Problem. It Has an AI Problem.

What Happens Next

The open questions this framework does not answer yet.

  • Does mNAV hold above 1, or was the rebound a bounce? Every week below parity is a week the accumulation engine stays mathematically stalled, no matter what Saylor tweets
  • Does Strategy actually sell, or does the $1.25 billion authorization sit untouched as a confidence prop? The first real sale under the program, whatever its size, will move the market more than the announcement did
  • STRC trades near $87.50 against $100 par. Until it recovers par, Strategy cannot issue new preferred at a profit to fund purchases, which leaves the reserve and the sell authorization as the main funding tools
  • July ETF flows. IBIT redeemed roughly $3.3 billion in June. If that pace holds, the ETF wrapper stays a bigger BTC seller than Strategy is even authorized to become
  • The FOMC meets July 28 and 29. A hawkish Warsh keeps pressure on everything above, a softer tone changes the whole equation
  • The CLARITY Act clock in the Senate, which JPMorgan itself names as the other condition for a stronger second half

Sources: SEC / Strategy Inc. Form 8-K, June 29, 2026, CoinDesk Strategy's valuation has fallen below the value of its bitcoin holdings, CoinDesk JPMorgan says Strategy's bitcoin sales policy adds two-way risk, Bloomberg JPMorgan Says Saylor's Strategy Adds New Risk to Bitcoin Market, The Block Strategy loses its bitcoin premium as enterprise mNAV dips below 1

Disclosure: This is analysis, not financial advice. We hold BTC. Do your own research before making investment decisions.

Thursday, July 2, 2026

The Fed Just Lost Its Reason to Hike

BitBrainers - The Fed Just Lost Its Reason to Hike

By BitBrainers Editorial

The US economy added 57,000 jobs in June. The forecast was 114,000. That is not a soft print, that is half of one, and it landed on a market that spent the last two weeks pricing in the opposite problem. On top of the miss, May's figure was revised down by 43,000 to 129,000, ending a three-month streak of payrolls beating expectations. Within hours, Bitcoin went from drifting below $60,000 to briefly trading above $62,000. The move was fast, but the repricing underneath it is the actual story.

One Report, Two Repricings

Remember where the market stood on Wednesday. The June FOMC dots projected at least one more rate hike before year end, several officials penciled in more than one, and Polymarket had the odds of another 2026 hike at 54 percent. The debate was not hikes versus cuts. It was hikes versus holding.

One jobs report moved both dials. Polymarket's hike probability dropped from 54 to 47 percent in a day. CME FedWatch now shows roughly 80 percent odds the Fed leaves rates unchanged at the July 28-29 meeting, up from about 72 percent before the print. Traders also priced out a September move entirely, pushing residual hike risk into October.

The setup helped. A day earlier at the ECB Forum, Fed Chair Kevin Warsh said inflation risks were easing. He gave no path, he never does, but paired with a payrolls number at half the forecast, the market did the math for him. Hiking into a labor market that just printed 57,000 is a hard sell, even for a Chair who spent his first meeting sounding hawkish. We covered that first meeting and what it did to Bitcoin in The Fed Chair Who Loved Bitcoin. Today was the first data point that pushed back.

The macro read, once a week, no hopium

Join the BitBrainers Weekly Brief. The week's real signal in one email.

Subscribe Free

The Bounce Comes With an Asterisk

Bitcoin rallied about 4 percent on the release and briefly reclaimed $62,000 before settling near $61,700. After the worst month since June 2022 and a roughly 30 percent decline across the first half of the year, any green candle gets attention. This one deserves some, and also deserves its asterisk.

The level that matters is $62,500. That is the halfway retracement of the recent leg down, and desks are treating it as the line between a relief rally and an actual recovery. Below it, today's move is short covering plus a macro sigh of relief. Above it, with follow-through, the conversation changes.

The heavier problem has not moved. US spot Bitcoin ETFs bled roughly 4 billion dollars in June, the largest monthly redemption since launch. A jobs report can reprice the Fed in an afternoon. It cannot reverse institutional flows. Until those stabilize, rallies in this tape are guilty until proven innocent.


The Part Nobody Wants to Price

Here is the uncomfortable read. The US economy needs roughly 100,000 new jobs a month just to keep the unemployment rate steady. June printed 57,000, and May was revised lower. One month below breakeven is noise. Two starts a trend, and a trend below breakeven stops being a Fed story and starts being a growth story.

Weak labor data helps risk assets exactly as long as it reads as "the Fed can relax" and not "the economy is stalling." That line is invisible until it is crossed, and markets historically cross it in one session. In 2019 and again in 2024, jobs misses were bought right up until a print landed that made cuts look like a rescue instead of a gift.

So the honest framing of today: Bitcoin got a real macro tailwind, the first one this summer. The hike case took genuine damage and the July meeting is now close to a formality. But 47 percent is still nearly a coin flip on the year, the ETF door is still swinging outward, and the same data that killed the hike will kill the rally if it repeats in August. Enjoy the bounce. Respect the asterisk.


On The Radar This Week

The FOMC meets July 28-29, and the market has effectively pre-decided a hold. The more interesting release is the next CPI print, because an inflation surprise is now the only thing that could put the hike back on the table. On the chart, $62,500 is the confirmation level above and $57,900 is the late-June low that has to hold below. And the quiet third dial is ETF flows: this bounce only becomes a trend if the redemption streak breaks. Watch for the first string of consecutive net inflow days since May. Until then, between those numbers, everything is noise.

Sources

US Bureau of Labor Statistics: The Employment Situation, June 2026
crypto.news: Bitcoin surges past $62K as U.S. payroll miss dents Fed rate hike odds
Investing.com: Bitcoin jumps to $62,000 as weak US jobs data eases rate-hike fears

Disclosure: This content is for informational purposes only and does not constitute financial advice. We may earn a commission through affiliate links at no extra cost to you. Always do your own research.

The FBI Director Bought Bitcoin Stock. He Just Forgot to Mention It for Six Months.

Kash Patel speaking with attendees at FreedomFest 2024

Photo: Gage Skidmore, CC BY-SA 2.0

By BitBrainers Editorial

The FBI director bought six figures of Bitcoin-adjacent stock, sat on the disclosure for six months, and the Justice Department's own ethics office says there's nothing to see here. The company he bought into does millions of dollars in business with his own agency. This is the kind of story that gets buried in a Wednesday news cycle, and it deserves better than that.

What Actually Happened

FBI Director Kash Patel purchased between $100,001 and $250,000 in Strategy stock, the company formerly known as MicroStrategy, on November 21. Strategy is the largest publicly listed corporate holder of Bitcoin in the world, built around aggressively accumulating BTC as its primary treasury asset. Patel did not disclose the trade to federal regulators until May 26, six months after the purchase and well past the 45-day window required under the STOCK Act.

His explanation, delivered in a letter to the Office of Government Ethics that same day, was that the trade had been "inadvertently omitted" from an earlier disclosure. Two days later, a Deputy Assistant Attorney General wrote to the same office stating the omission was caused by an unspecified "miscommunication." An FBI official told reporters the late filing was "not realized and unintentional."


Why The Company Matters As Much As The Delay

A late disclosure alone is a paperwork problem. What makes this one worth reading past the headline is who Patel bought stock in. Strategy has done millions of dollars in business with the Department of Justice over the past decade, and the FBI is part of the Department of Justice. Patel now personally holds a six-figure position in a company his own agency writes checks to.

The Deputy Assistant Attorney General who reviewed the case concluded there was no conflict of interest. Government watchdogs disagree with the framing entirely. Dylan Hedtler-Gaudette of the Project on Government Oversight put it in blunt terms: "That's violating the law, no other way to put it." He's referring specifically to the disclosure timeline, not the ethics question, but the two are hard to fully separate here. Late disclosure and financial entanglement with an agency contractor are not the same problem, but they compound each other.

Worth being fair about the baseline here. Senior officials holding stock in companies their agency interacts with is not automatically a scandal, Pentagon officials often hold defense contractor stock, HHS officials hold pharma stock. Passive investment in a publicly traded company isn't prohibited on its own, that's exactly why ethics offices exist to make case-by-case calls rather than ban the practice outright. No evidence has surfaced that Patel steered any DOJ contract toward Strategy, traded on non-public information, or received anything in return for the purchase. The documented complaint is narrower than "corruption": a six-figure trade, a company with agency ties, and a disclosure filed roughly 186 days late. That's still a real problem. It's just a specific one, not a vague one.

This also isn't Patel's first time drawing scrutiny for personal stock trades in office. He purchased shares in Krispy Kreme and ON Semiconductor in 2025, trades that already prompted questions from members of Congress before this latest disclosure issue surfaced. A pattern of individual stock trading while running a federal law enforcement agency is its own separate conversation from any single trade's merits.


The Rules Everyone Ignores

The STOCK Act exists for exactly this reason: to make sure senior officials disclose trades fast enough that the public can see potential conflicts before they compound. The threshold is low, any trade over $1,000, and the window is short, 45 days. Patel's trade sat undisclosed for roughly six times that window.

He is not alone. NOTUS, the outlet that first reported this story, has identified more than 30 members of Congress who filed STOCK Act disclosures late over the past year. The customary penalty for a first violation is a $200 fine, a number small enough that it functions less as a deterrent and more as a rounding error against a quarter-million-dollar trade. Patel has not been fined as of this writing, and multiple watchdog groups doubt he will be.

This is the kind of read you get weekly.

No hype. No "this coin will 100x." Just honest macro on Bitcoin, gold, and the market.

What This Says About Bitcoin's Position In Washington

Set aside the ethics question for a moment and look at what this story confirms about where things actually stand. A sitting FBI director felt comfortable putting a six-figure personal position into a Bitcoin treasury company, one connected to his own agency's contractor relationships, and the mistake that got him in trouble wasn't the trade itself, it was the paperwork. Nobody in this story is arguing Patel shouldn't have bought Strategy stock. The argument is entirely about timing.

That's a meaningful signal on its own. Bitcoin exposure has moved deep enough into Washington's bloodstream that a law enforcement official's personal stake in the largest corporate BTC holder barely registers as controversial, only the six-month delay in reporting it does. A few years ago this trade wouldn't have happened at all, or would have drawn scrutiny on the merits, not just the calendar.


Worth Watching Right Now

Strategy's stock itself remains under separate pressure. Canaccord cut its price target on the company this week even while maintaining a broadly bullish thesis on Bitcoin, part of a wider reassessment of Strategy's capital structure following its recently disclosed unrealized paper losses and new buyback authorization. Meanwhile Trump's own 2025 financial disclosure, released the same week, showed over $1.4 billion in crypto-related income, a separate and much larger story about the overlap between federal power and Bitcoin exposure that deserves its own treatment.

Sources

NOTUS. Kash Patel's Late Stock Disclosure Raises STOCK Act Questions

CoinDesk. FBI Director Kash Patel Caught Sleeping on Required Disclosure of Six-Figure MSTR Investment

Raw Story. Kash Patel Accused of 'Violating the Law' With Massive Undisclosed Stake in DOJ Contractor

BitBrainers. We check the facts so you don't have to.

Disclosure: This is market and policy commentary, not financial or legal advice. We hold Bitcoin. Always do your own research.

Wednesday, July 1, 2026

Why Your Exchange Wants You to Stay (And What Actually Fixes It)

BitBrainers - fractured Bitcoin coin with capital flowing toward AI infrastructure

By BitBrainers Editorial

Every exchange interface is built around one goal: keep your coins on their platform. Not because they're malicious by design, but because your balance sitting on their books is the entire business model. The friction to withdraw isn't an accident. It's revenue protection.

The Balance Sheet You Never See

When you deposit Bitcoin on an exchange, you don't hold Bitcoin anymore. You hold an IOU. The exchange holds the actual private keys, and your balance is just a number in their database. That number can be lent out, used as collateral, or in the worst case, gone before you ever try to withdraw it.

FTX proved this isn't theoretical. Sworn testimony and court filings later confirmed that Alameda Research, the trading firm founded by the same person who ran FTX, had been drawing on customer deposits for years before the collapse, using them as an open line of credit that reportedly ran into the tens of billions. The exchange marketed itself as the safest place to hold crypto while quietly reinvesting customer funds behind the scenes. When withdrawals spiked in November 2022, the gap between what customers thought they owned and what the exchange actually had on hand became impossible to hide. A U.S. court later ordered $12.7 billion in restitution and disgorgement, one of the largest judgments in the history of financial fraud enforcement. None of that money would have been at risk if it had never left customer wallets in the first place.

Three Ways They Profit While You Wait

Trading fees are the obvious one, but they're rarely the biggest. Spread markup on market orders quietly costs more than the stated fee on most retail trades. Interest on idle deposits is another: your uninvested cash or stablecoins often earn the exchange yield in the background while you earn nothing. And withdrawal friction, minimum amounts, network fee markups, occasional "verification delays," all nudge you toward leaving funds parked rather than moving them out.

None of this requires bad intent. It's just what happens when the platform's incentives and your incentives point in different directions. I watched this exact dynamic from the inside on a CFD brokerage desk. The house doesn't need you to lose. It just needs you to stay active and stay parked.

Worth saying plainly: not every exchange is FTX. Platforms like Kraken that publish proof-of-reserves and submit to third-party audits are a meaningfully different risk than one that hides its balance sheet entirely. Some withdrawal friction is also just regulation doing its job, KYC and AML checks exist to catch fraud and stolen funds, not only to slow you down. The incentive misalignment is still real. It's just not the whole story on every platform.

This is the kind of read you get weekly.

No hype. No "this coin will 100x." Just honest macro on Bitcoin, gold, and the market.

What Self-Custody Actually Fixes

Self-custody removes the middleman from the equation entirely. Your keys, your coins, no balance sheet risk, no lending desk, no "temporary" withdrawal freeze during a bank run. It doesn't eliminate risk, you take on the responsibility of not losing your own keys, but it converts counterparty risk into a risk you fully control.

A hardware wallet like a Trezor keeps your private keys offline, away from any exchange's balance sheet. Setup takes minutes. The habit of moving funds off-exchange after every trade takes longer to build, but it's the difference between owning Bitcoin and owning a promise.

Be honest with yourself about the tradeoff. More people lose crypto to their own mistakes, a lost seed phrase, a phishing link, a backup that was never written down, than to an exchange collapse. Self-custody removes one risk and hands you a different one. It's still the better trade for anything you're not actively using, but only if you take the seed phrase part seriously.

The Middle Ground

You don't need to self-custody every dollar you trade with. Keep active trading capital on the exchange, move everything else off. Treat the exchange like a checking account, not a savings account. That single mental shift changes how much risk you're actually carrying at any given time.

The Test That Actually Tells You Something

Forget reading the terms of service. There's a faster way to gauge how an exchange treats withdrawals: try one. Move a small, real amount off the platform and time it. A clean process, clear fees, and funds landing in your wallet within the stated window is a good sign. Repeated "verification required" prompts, minimums that conveniently sit above what you're trying to move, or support tickets that go nowhere are the same pattern that preceded past exchange failures, just earlier in the timeline. This costs you a few dollars in network fees. It's a cheap way to find out what a five-figure or six-figure withdrawal would actually look like before you need it to work.

Worth Watching Right Now

The EU's MiCA transitional licensing period expired today, July 1. Roughly 92 percent of the exchanges and crypto businesses that previously operated under older national licenses across Europe still lack full MiCA authorization, leaving them to either secure a license, wind down, or transfer clients to an already-licensed platform. Separately, Strategy authorized a new $2 billion buyback program alongside a mechanism that would let it sell bitcoin for liquidity if needed, a notable shift from its prior all-in accumulation stance. Bitcoin extended its slide below $58,500 this week, with roughly $320 million in leveraged positions liquidated in a single day.

Sources

CFTC, consent order and $12.7 billion judgment against FTX and Alameda Research, August 2024. Forbes, coverage of the FTX/Alameda restitution ruling, August 2024. Axios, FTX trial testimony on Alameda's use of customer funds, October 2023.

BitBrainers. We check the facts so you don't have to.

Disclosure: This post contains affiliate links. We may earn a commission at no extra cost to you.

Monday, June 29, 2026

Bitcoin Weekly Brief: June 29 — The First Bear Without a Crypto Trigger

BitBrainers - Bitcoin daily chart, five-day consolidation in the $58K to $60K range

By BitBrainers Editorial

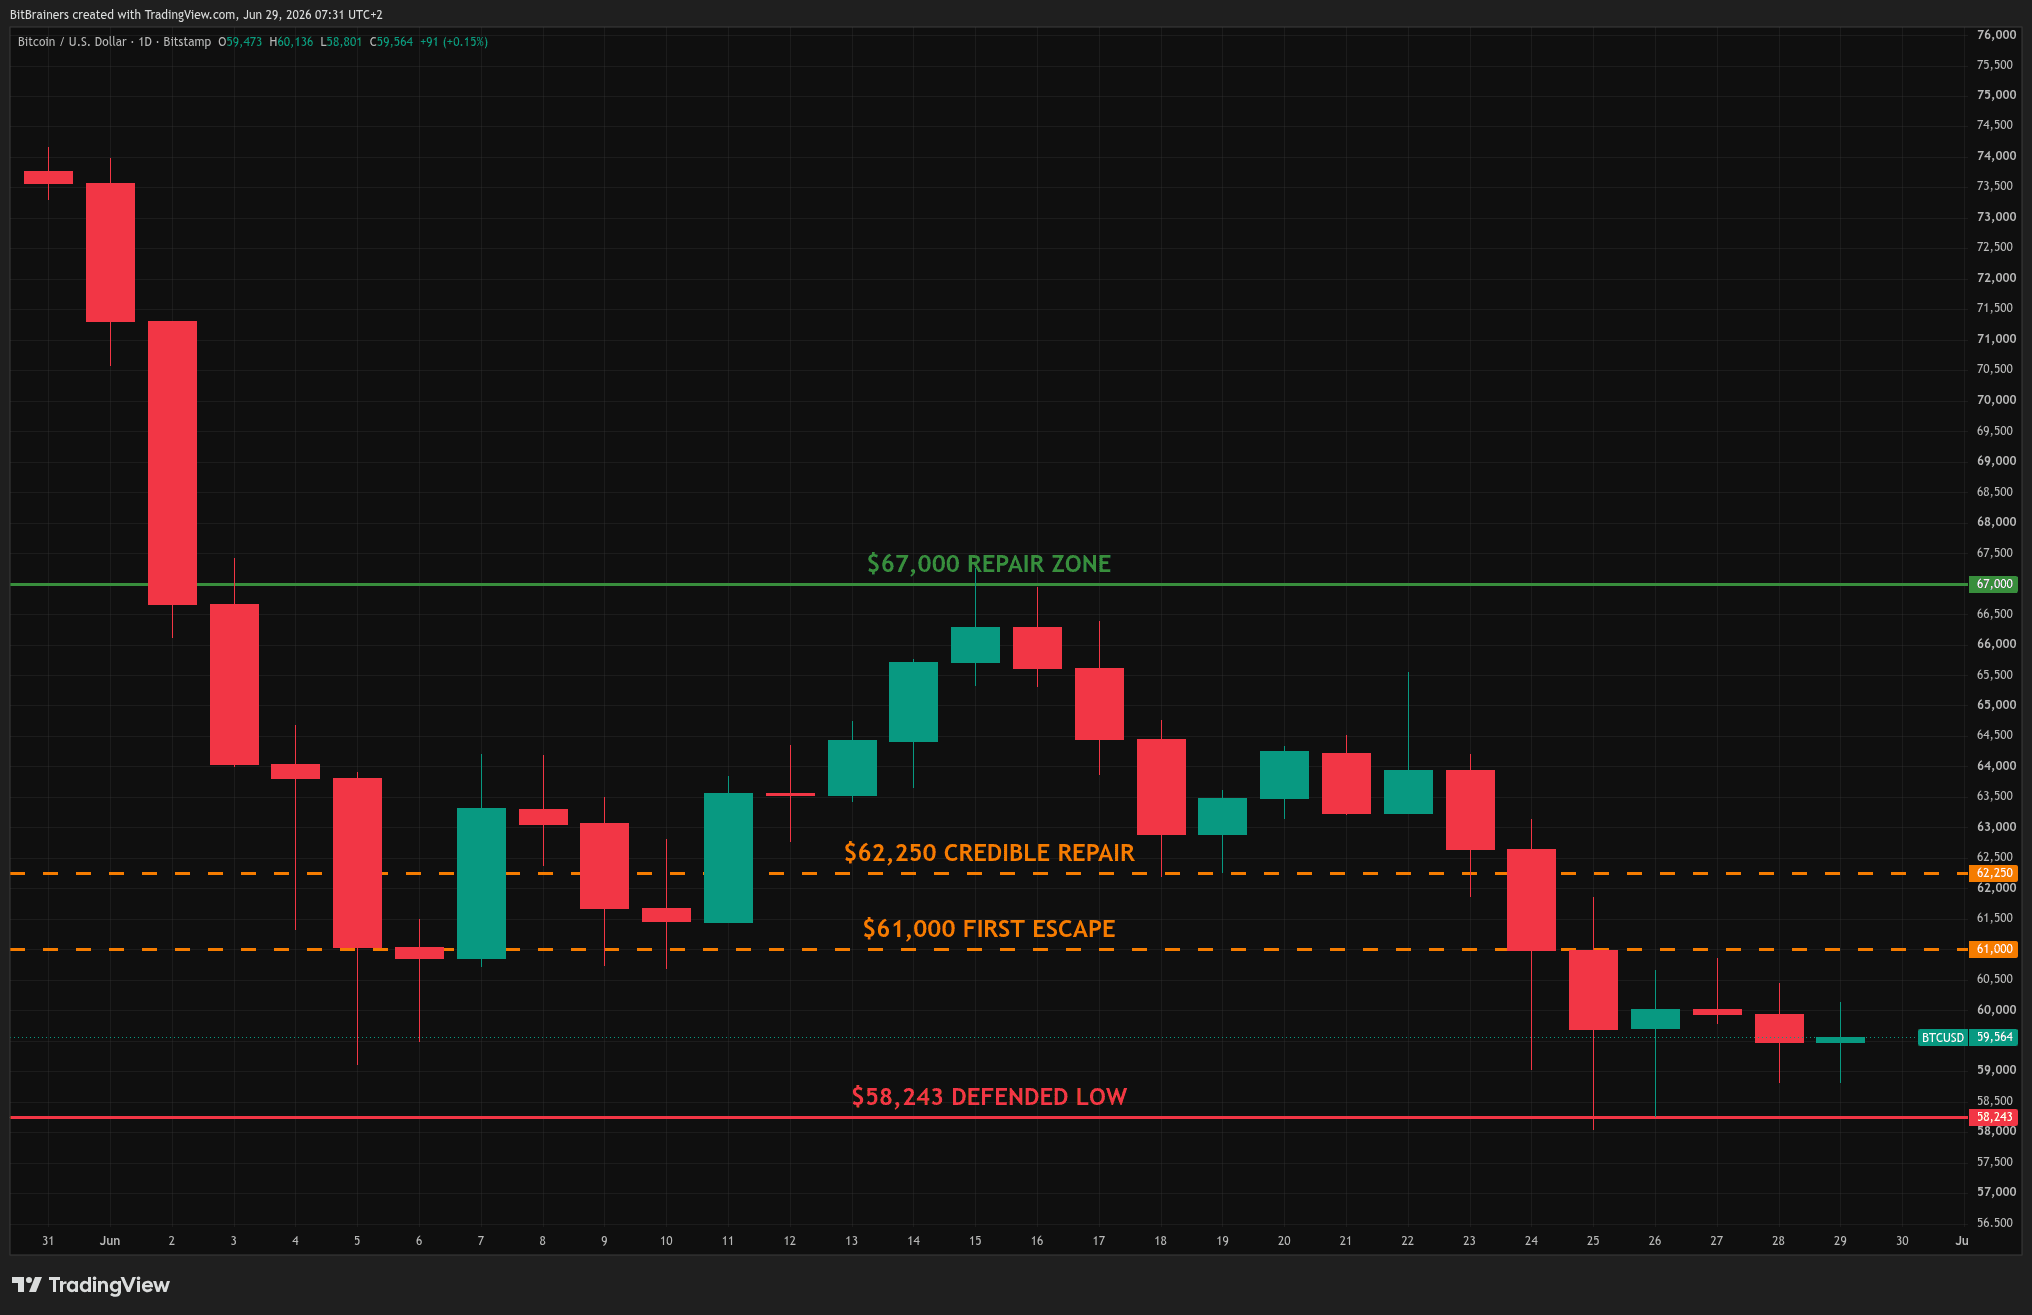
Bitcoin closed the week below $60,000 for the fifth straight day, sitting on a $58,243 low that buyers have defended since Wednesday. Volume on the way down kept thinning. A Friday options expiry that everyone thought would yank price toward $72,000 did nothing of the sort. And the most interesting thing about all of it is that none of it was caused by a crypto problem.

Where Bitcoin Actually Closed The Week

The range tells the story without needing a narrative. BTC opened Monday around $63,000, slipped through midweek as hot inflation data hit, made a $58,243 low on Wednesday, bounced toward $60,500, and faded back. Five sessions, one defended floor, no decisive break. The $10 billion Deribit quarterly expiry on Friday cleared with max pain at $72,000 and spot at $59,500. Nothing pinned. Nothing pulled.

What did move: ETF outflows kept bleeding, with combined US spot crypto ETF assets falling from roughly $104 billion to $94 billion over the past few weeks. Fear and Greed sat in extreme fear all week, ticking from 13 to 18 by Sunday, which is the kind of marginal improvement that means buyers are exhausted, not that anything has turned. Realized losses ran around $1.35 billion per day. The bleed is real. It is just slow.


Why This Bear Has No Crypto Trigger

Every prior Bitcoin bear had a crypto-native cause. 2011 was the Mt Gox hack. 2013 was the China PBoC ban. 2018 was the ICO bubble unwinding. 2022 was Luna collapsing and FTX going under. Each one had a moment, an event, a date on a Wikipedia page.

This one does not.

What pushed Bitcoin from $73,000 to $58,243 over the last two weeks was a hot PCE inflation print, a Fed that may now be re-hiking instead of cutting, and capital rotating into AI infrastructure on a structural multi-year capex story. None of those are about Bitcoin. They are about every risk asset that ever borrowed against a low-rate liquidity backdrop. The shape of the chart looks like the prior bears. The cause looks like nothing the prior bears had.

One qualifier worth saying out loud. Spot ETFs are a new transmission mechanism that didn't exist in any prior cycle, and the outflows we've seen this month are crypto-specific in the sense that they show up directly in BTC sell pressure. That's not the same as a Mt Gox or an FTX, but it is a piece of plumbing the prior bears didn't have. Macro causes the risk-off impulse. The ETFs translate it into daily forced supply faster and more visibly than before.

That distinction matters because the playbook traders inherit from prior cycles assumes a known trigger and a known resolution. Mt Gox, ICOs, FTX, those all eventually washed through and the next leg began. There is no equivalent washout coming here, because there is nothing crypto-native to wash. The bottom, when it arrives, will not be marked by a single event. It will be marked by a quiet change in flow.


Macro Did The Work

The May PCE inflation report came in hot on June 25, headline 4.1% year over year, the highest reading since 2023. Markets repriced the odds of a December Fed rate hike to roughly 77%, with Bank of America now expecting three hikes in 2026 and Deutsche Bank modeling two starting as early as September. The day's print triggered around $1.48 billion in crypto-wide liquidations within 24 hours, Bitcoin alone taking roughly $665 million of that.

Underneath the inflation story, a quieter rotation is doing the structural damage. The five largest US hyperscalers have committed to spending about $725 billion on AI infrastructure in 2026, a 77% jump from the prior year. Nvidia is guiding to about $91 billion in revenue this quarter alone. AI-exposed names now account for roughly 45% of the S&P 500's market cap. Excluding AI, the rest of the index has barely moved since February. The growth capital that used to chase Bitcoin on good weeks is finding a different home, and until that flow reverses, BTC is bidding for a marginal buyer that is currently busy elsewhere.

This is the kind of read you get weekly.

No hype. No "this coin will 100x." Just honest macro on Bitcoin, gold, and the market.

The Absorption Question Is Still Open

The character of this leg down is what makes it worth watching, separate from the price. February took Bitcoin from the low $80,000s to $60,000 in five trading days on heavy volume, the kind of move that liquidates leveraged longs in bulk. This time, the same trip down took 26 days on a fraction of the volume, then bled another 11 days into the $58,243 low we are still defending.

Slower decline on lighter volume can mean absorption, the most leveraged sellers already cleaned out in February with less forced supply left to push. It can also mean buyers simply have no urgency, letting price drift lower because nothing is stopping them. The volume tells you effort is dropping. It does not tell you whose effort. An independent analyst at InvestingLive flagged the same read on Sunday, calling it a "bearish lower-value reset with early absorption, not confirmed accumulation." Same question, two desks, no answer yet.

What would settle it is a real reaction. A reclaim of $67,000 that holds with volume expanding behind it. Not a weak bounce that fades back into the range on light volume, no matter how relieved that bounce might feel.


Key Levels

Level Type Significance
$67,000 Repair zone A reclaim and hold here on rising volume is what flips absorption from question to confirmation
$61,750 to $62,250 Credible repair Reclaiming this band starts to show value migration back toward the prior structure
$60,750 to $61,000 First escape gate The immediate ceiling. Above it, the score starts improving from bearish toward neutral
$58,115 to $58,400 Defended low Where buyers have shown up for five sessions. Losing it cleanly opens $55,000

What This Adds Up To

This is the first Bitcoin bear without a crypto-native cause and the first to happen with a major competing growth trade actively pulling capital the other direction. The drawdown is shallower than prior cycles. The character is slower. The drivers are macro and structural, not native to crypto. That does not make a bottom call. It changes the signal you should be watching for. Volume on the next meaningful bounce will say more than any of this week's headlines. Until something gives, the chart is asking a question, and nobody on either side has earned the answer yet.


Sources

CoinGecko. Bitcoin Price Today

InvestingLive. Bitcoin Analysis Over the Weekend, 28 June 2026

Reuters. May PCE Inflation Report and Fed Rate Expectations

BitBrainers. We check the facts so you don't have to.

Disclosure: This is market commentary, not financial advice. We hold Bitcoin. Always do your own research.

Sunday, June 28, 2026

Bitcoin Doesn't Have a Crypto Problem. It Has an AI Problem.

BitBrainers - Bitcoin's AI Problem

By BitBrainers Editorial

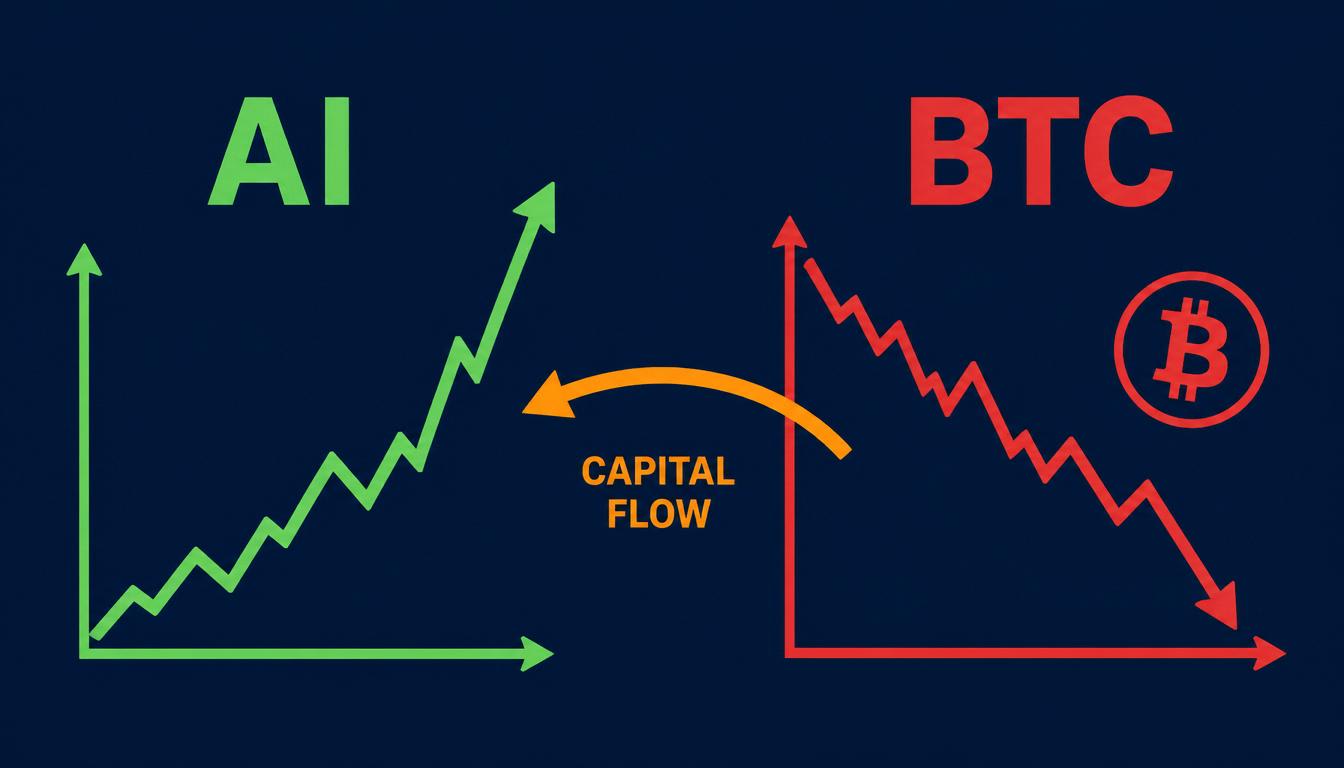
Most of the explanations for Bitcoin's slow grind to $58,000 are about Bitcoin. Inflation surprised the Fed, ETF outflows broke a record, max pain failed to pull. All true, all priced. But the simplest story is the one nobody on crypto Twitter is leading with: the capital that used to chase Bitcoin on good weeks is building data centers instead, and it's not coming back until that trade cools.

The Numbers Don't Compete, They Diverge

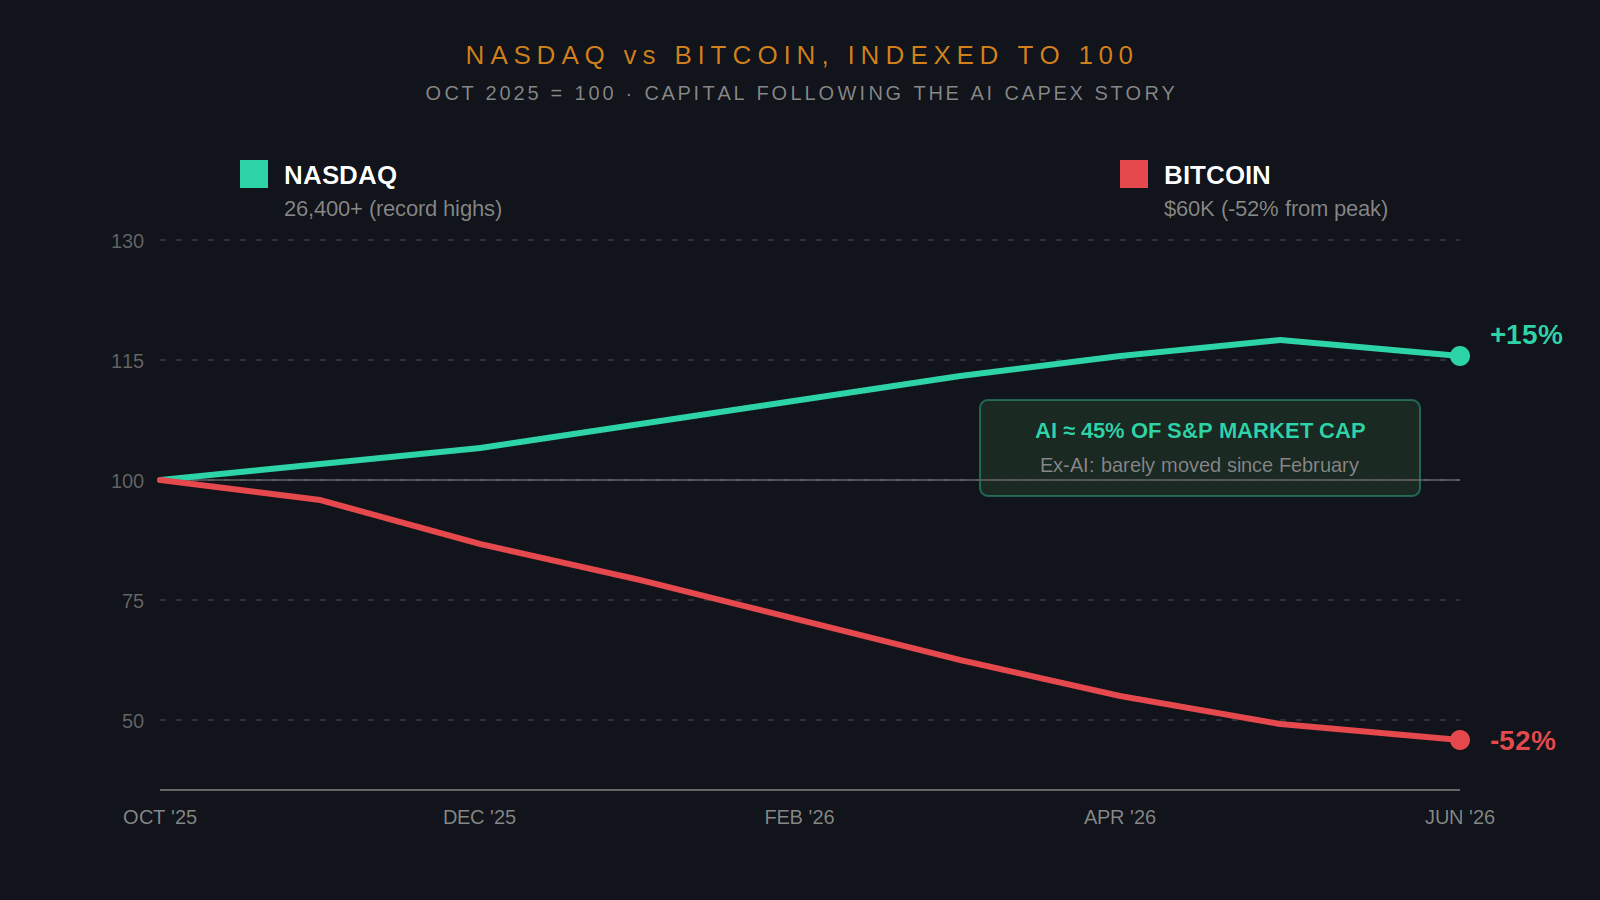
The Nasdaq Composite is sitting above 26,400, near record highs. Bitcoin is down roughly 50% from its October 2025 peak. That gap isn't a coincidence, it's a flow. Excluding AI-related stocks, the rest of the S&P 500 has barely moved since February. The index's gains this year have come almost entirely from a handful of names exposed to AI infrastructure. Nvidia, Microsoft, Meta, Alphabet, Amazon. Same names doing all the work.

On the spending side, the scale is genuinely hard to internalize. The five largest US hyperscalers, Microsoft, Alphabet, Amazon, Meta, and Oracle, have collectively committed to spending around $725 billion on capital expenditure in 2026. That's a 77% jump from the prior year's already record $410 billion. CreditSights estimates roughly 75% of that, close to $450 billion, flows straight into chips, servers, networking, and physical data center buildouts. Nvidia alone is guiding to about $91 billion in revenue for the current quarter, up 85% from a year earlier.

Half a trillion dollars is being committed to a single theme. Crypto doesn't have a competing capex story. It doesn't need one for the long-term thesis, but in the short term, it means the marginal investor's attention is somewhere else.


Same Wallet, Different Bet

The cleanest way to read crypto's drift lower this cycle is to stop thinking of it as a separate market. Crypto and high-growth tech share a marginal buyer, the kind of investor who wants asymmetric upside in volatile assets. When liquidity is loose and confidence is high, that buyer holds AI stocks, Bitcoin, crypto equities, and some smaller tokens all at once. When confidence cracks, the whole basket gets trimmed, but not evenly. The AI infrastructure trade has a story, a multi-year capex commitment, and earnings to point at. Bitcoin has a chart with no catalyst.

That's why so many of crypto's recent down legs haven't been triggered by crypto news. The June selloff lined up with the May PCE inflation surprise, the same surprise that hit tech harder than usual for one session before tech recovered and crypto didn't. The asymmetry isn't sentiment. It's positioning. When the same investor de-risks a portfolio, the asset with the weaker near-term narrative gets cut first, and right now that asset is Bitcoin.

BitBrainers - Nasdaq vs Bitcoin divergence indexed to October 2025

This shows up cleanly in flows. Combined US spot crypto ETF assets fell from around $104 billion to $94 billion over the past few weeks. The week of May 23 to 29 alone saw global crypto exchange-traded products bleed $1.67 billion, the second-largest weekly outflow of the year. ETF demand was the engine of the 2024 and 2025 rally. When that engine runs in reverse, spot price loses its most dependable marginal buyer, and right now the money that used to feed that engine has a different home.

One nuance worth saying directly so it doesn't get assumed away. This isn't a literal dollar transfer from Bitcoin ETFs into Nvidia shares. Hyperscaler capex is mostly funded by corporate cash flow and corporate debt, not by retail investors selling BTC to buy chip stocks. The transmission is allocator psychology and opportunity cost, not a direct one-to-one swap. When growth-oriented investors look at where the cleanest multi-year story lives, AI infrastructure wins that comparison right now, and Bitcoin loses the marginal attention even if no one explicitly moves a dollar between the two.

This is the kind of read you get weekly.

No hype. No "this coin will 100x." Just honest macro on Bitcoin, gold, and the market.

The Buildout Isn't Slowing, It's Accelerating

The first instinct, looking at a $725 billion number, is to assume it has to plateau or break. The data says otherwise. The buildout has moved past the point where it's funded purely from operating cash flow. Hyperscalers raised $108 billion in debt during 2025 alone to keep pace, and CreditSights projects roughly $1.5 trillion in cumulative debt issuance over the coming years to fund the rest.

This matters for crypto because debt-funded infrastructure cycles don't pause for sentiment. They pause when something physical breaks, power supply, grid capacity, chip lead times, or when the revenue side genuinely fails to materialize. Neither has happened. Microsoft just confirmed its AI business surpassed an annual revenue run rate of $37 billion, up 123% year over year. Commercial remaining performance obligations stand at $627 billion. The forward demand is there.

The implication is uncomfortable but worth saying out loud. If the AI infrastructure trade keeps working, the marginal capital that crypto needs back for a real rally is going to keep finding a better home. The competition isn't a single tech stock. It's an entire structural buildout with multi-year visibility.


What Would Actually Reverse This

Three things, and at least one of them probably has to happen for the rotation to flip.

First, AI leadership has to cool. Not collapse, just rotate. When the trade that's draining crypto starts losing momentum, risk capital has historically circled back. The early warning sign is the kind of session where a hot inflation print hits Nvidia harder than it hits Bitcoin, instead of the inverse. We're not there yet.

Second, ETF flows need to turn. Not a single positive day, a sustained run, especially in the largest vehicles like BlackRock's IBIT. That's the cleanest read on whether the marginal seller is finally exhausted. Persistent flat-to-positive flow in the biggest funds is the structural signal worth waiting for.

Third, the macro picture needs a different driver. As long as hot inflation prints repricing Fed expectations toward hikes are the dominant story, the dollar stays strong, risk assets stay pressured, and the higher-conviction trade keeps winning. Bitcoin doesn't need a bullish Fed to rally, but it does need one that isn't actively pushing the other way.

One thing worth noting about the eventual reversal, whenever it comes. Bitcoin's historical beta to risk assets cuts both ways. The same dynamic that's punishing it in this regime, lower liquidity hits it harder than tech, is exactly what could make it outperform on the way back. When the rotation does flip, the asset that fell furthest tends to move first and fastest. That doesn't make the timing easier, but it does mean the eventual recovery, if and when it arrives, may not look like a slow rebuild. It rarely has before.

On The Radar

Watch Nvidia's next earnings session, not for the number itself but for how Bitcoin trades on it. A Nvidia beat that doesn't lift BTC is one signal, an Nvidia miss that doesn't crush BTC is another. Watch the iShares Bitcoin Trust daily flow data as the closest available read on whether institutional appetite is genuinely turning. And watch the hyperscaler debt issuance pipeline. The moment that market starts demanding meaningfully wider spreads to fund the buildout is the moment the AI trade gets harder to extend, and crypto's marginal buyer might start looking for somewhere else to be.


Sources:
Investing.com: Bitcoin Can't Find a Floor While AI Quietly Soaks Up the Risk Capital
Futurum Group: AI Capex 2026: The $690B Infrastructure Sprint
Yahoo Finance: Meta, Microsoft, Amazon, and Alphabet's Shocking Spending to Dominate the AI Era
Benzinga: Money Is Flowing into AI Stocks While Bitcoin Liquidates

Disclosure: This is not financial advice. We hold positions in BTC and discuss our own trades publicly, wins and losses.

Saturday, June 27, 2026

Money Got Binance in the Room. A Record Kept It at the Door.

BitBrainers - The MiCA Filter

By BitBrainers Editorial

Three days before the MiCA enforcement deadline, the largest crypto exchange in the world withdrew its license application in Greece. Binance didn't fail because the application was too expensive, or because it lacked lawyers, or because it didn't understand the rules. It failed because of the part of compliance you can't pay your way out of: a record.

The Numbers Behind The Deadline

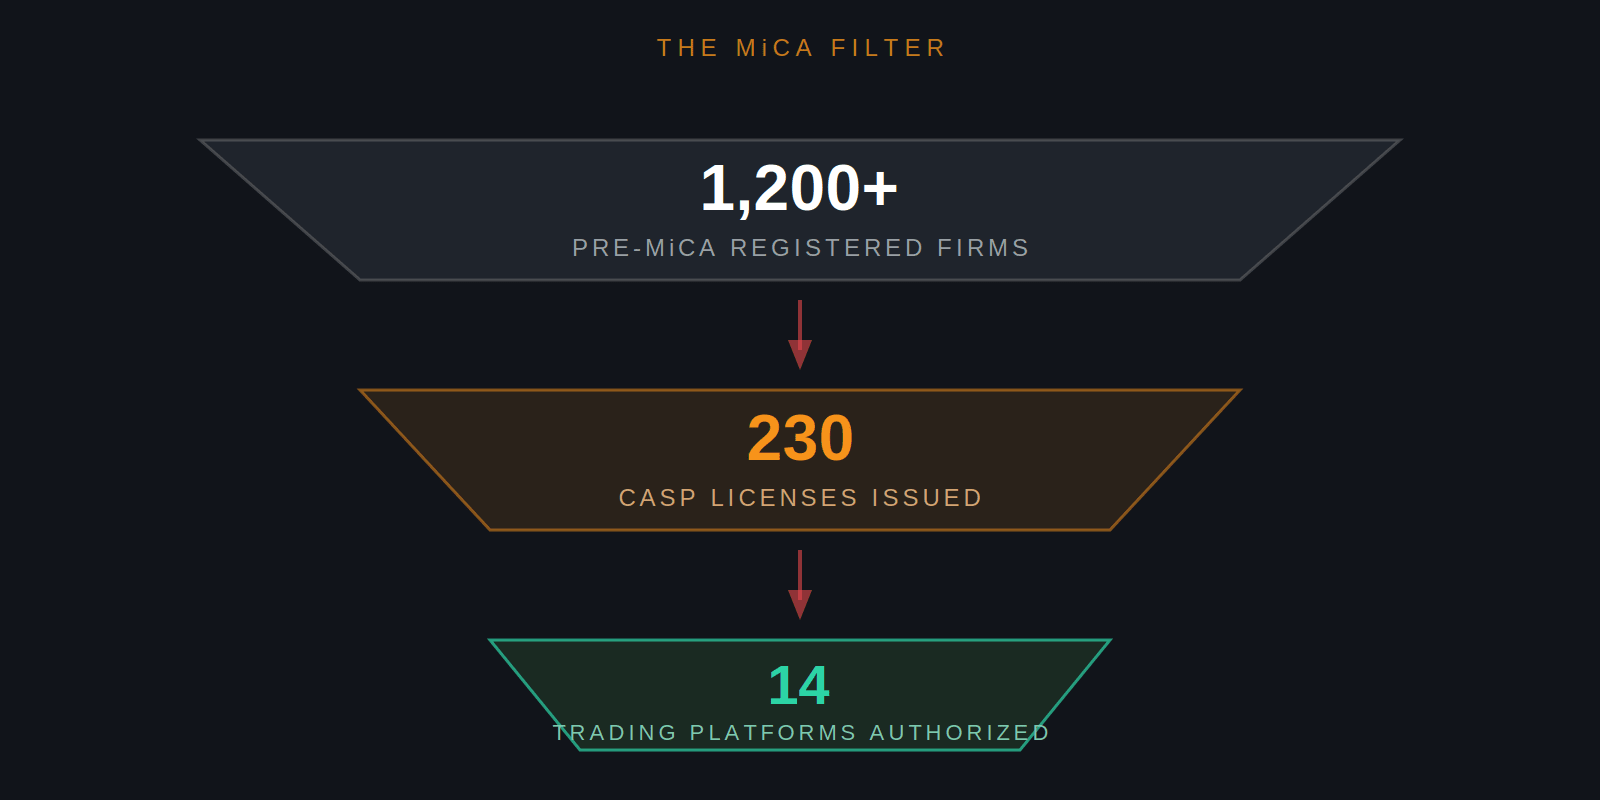
July 1, 2026 ends the 18-month transitional period under the EU's Markets in Crypto-Assets regulation. Around 230 firms now hold full CASP authorization across the bloc. Of those, only about 14 are cleared to run an actual trading platform. The pool they came out of was more than 1,200 firms registered under the old national rules.

That's a 19% conversion rate at the broad level, and roughly 1% at the trading-platform level. Ten EU member states haven't issued a single license. Estonia, which had 641 registered crypto firms in 2021, was down to about 40 by early 2025. France's regulator estimates that 40% of its registered providers never even submitted a MiCA application. Poland's national implementation law was vetoed for a third time in June, leaving Polish firms with no domestic path at all.

None of that is a story about firms running out of money. It's a story about firms running out of room.


What Money Couldn't Solve

The compliance cost of a MiCA authorization runs between €250,000 and €500,000 according to French regulators. For a small firm in Tallinn, that's existential. For Binance, it's a rounding error. So when Binance pulled its Greek application on June 24, the question wasn't budget. Reuters reported the Hellenic Capital Market Commission was preparing to reject the file. The reasons named in the reporting weren't capital or product gaps. They were past money-laundering penalties and corporate-structure issues, the kind of legacy concerns a fresh check can't paper over.

Binance has navigated this before. It holds a full MiCA passport through an EU entity it redomiciled and rebuilt in 2025, after rejections elsewhere on similar grounds. The Greek withdrawal isn't proof Binance can't get licensed; it already is, elsewhere. It's proof that even with the world's deepest war chest, you don't get a clean run at every jurisdiction. Some doors stay closed for reasons that pre-date the application.

That's the part of MiCA the headline numbers obscure. The framework didn't filter for size or balance sheet. It filtered for record. A clean compliance history, a manageable corporate structure, and the willingness to relocate to a jurisdiction that wants you became the actual currency.

This is the kind of read you get weekly.

No hype. No "this coin will 100x." Just honest macro on Bitcoin, gold, and the market.

The Map MiCA Drew

Look at where the licenses actually went, and a clear geography emerges. Germany leads with around 53 authorized entities. The Netherlands sits at 25 or 26. France, Malta, Cyprus, Ireland, and Luxembourg fill out most of the rest. Almost every major exchange that survived chose Ireland, Luxembourg, Malta, or the Netherlands as its EU base.

That's not random. Those are the jurisdictions that built a regulator willing to engage early, set realistic timelines, and process applications at scale. The countries that issued zero licenses weren't all small or hostile to crypto. Some were simply slow, understaffed, or politically conflicted about whether to compete for the business at all. Poland is the extreme case, but it's not the only one.

For users, that produces a strange map. After July 1, where you can legally trade crypto inside the EU depends less on where you live and more on where your exchange chose to redomicile. A Polish trader using a Polish-registered firm has a worse setup than a Polish trader using a firm passported in from Ireland, even though both users are sitting in the same country.


The Quiet Part Of The Stablecoin Story

The most visible casualty so far has been Tether. Tether didn't apply for MiCA authorization, and EU-licensed venues that continue listing non-authorized stablecoins risk losing their own CASP licenses. Coinbase began delisting USDT for EEA users in December 2024. Kraken followed in early 2025. Crypto.com delisted it alongside nine other tokens. Binance geofenced its EEA USDT pairs.

What gets less attention is what filled the gap. Circle's USDC and EURC are the only top-10 stablecoins fully MiCA-compliant, which puts them in a near-monopoly position for compliant euro and dollar exposure inside the EU. That's not a small consequence. It's the regulatory equivalent of being handed the only umbrella when it starts raining. Whether that's a feature or a flaw of MiCA's design depends on how comfortable you are with one issuer holding that much of the regulated market.

On The Radar

Watch how unlicensed firms communicate to EU users in the next 72 hours. France's AMF has explicitly warned that operating without authorization after the deadline exposes firms to criminal prosecution, so legal-quality wind-down notices should accelerate. Watch where Binance lands next on the MiCA application front, after Greece. And watch whether the European Commission's proposal to centralize CASP supervision inside ESMA itself gains ground after July 1, which would be a structural shift away from the current member-state model and is already being opposed publicly by Malta.


Sources:
Bitcoin.com News: MiCA Deadline Hits July 1 as Unlicensed Crypto Platforms Face EU Shutdown Risk
Yahoo Finance: July 1 MiCA Deadline Looms: More Than 80% of EU Crypto Firms Still Unlicensed
Kraken Blog: MiCA Enforcement Begins July 1: What It Means for Institutional Counterparties

Disclosure: This is not financial advice. We hold positions in BTC and discuss our own trades publicly, wins and losses.

The Fed Meets Tomorrow. Bitcoin Is Watching the Wrong Number.

By BitBrainers Editorial Tomorrow at 2pm ET, the Federal Reserve announces whether the fed funds rate holds at 3.50 to 3.75 percent o...

The Fed Meets Tomorrow. Bitcoin Is Watching the Wrong Number.