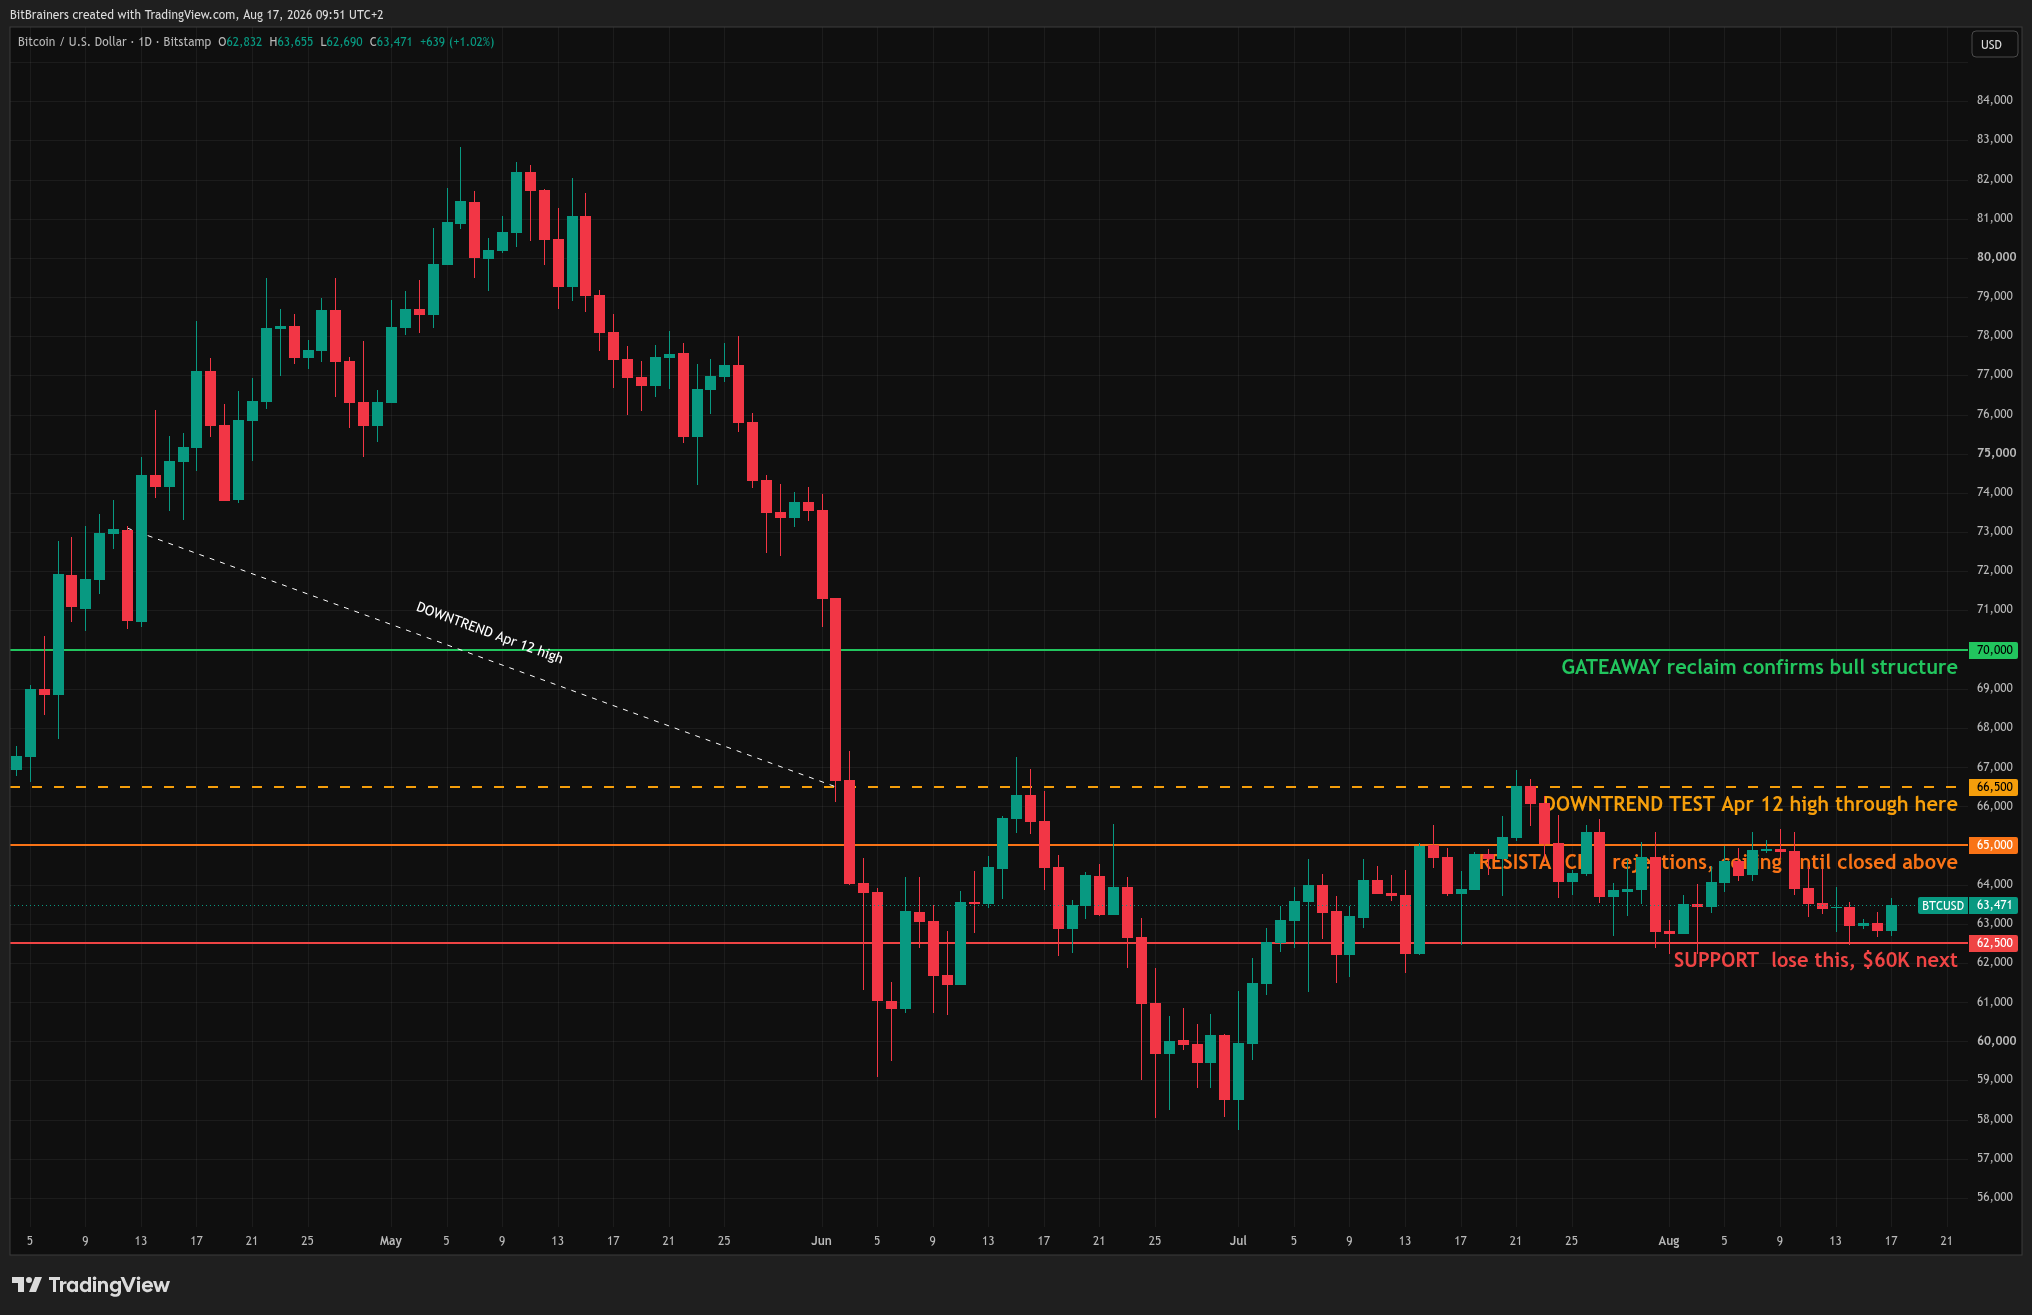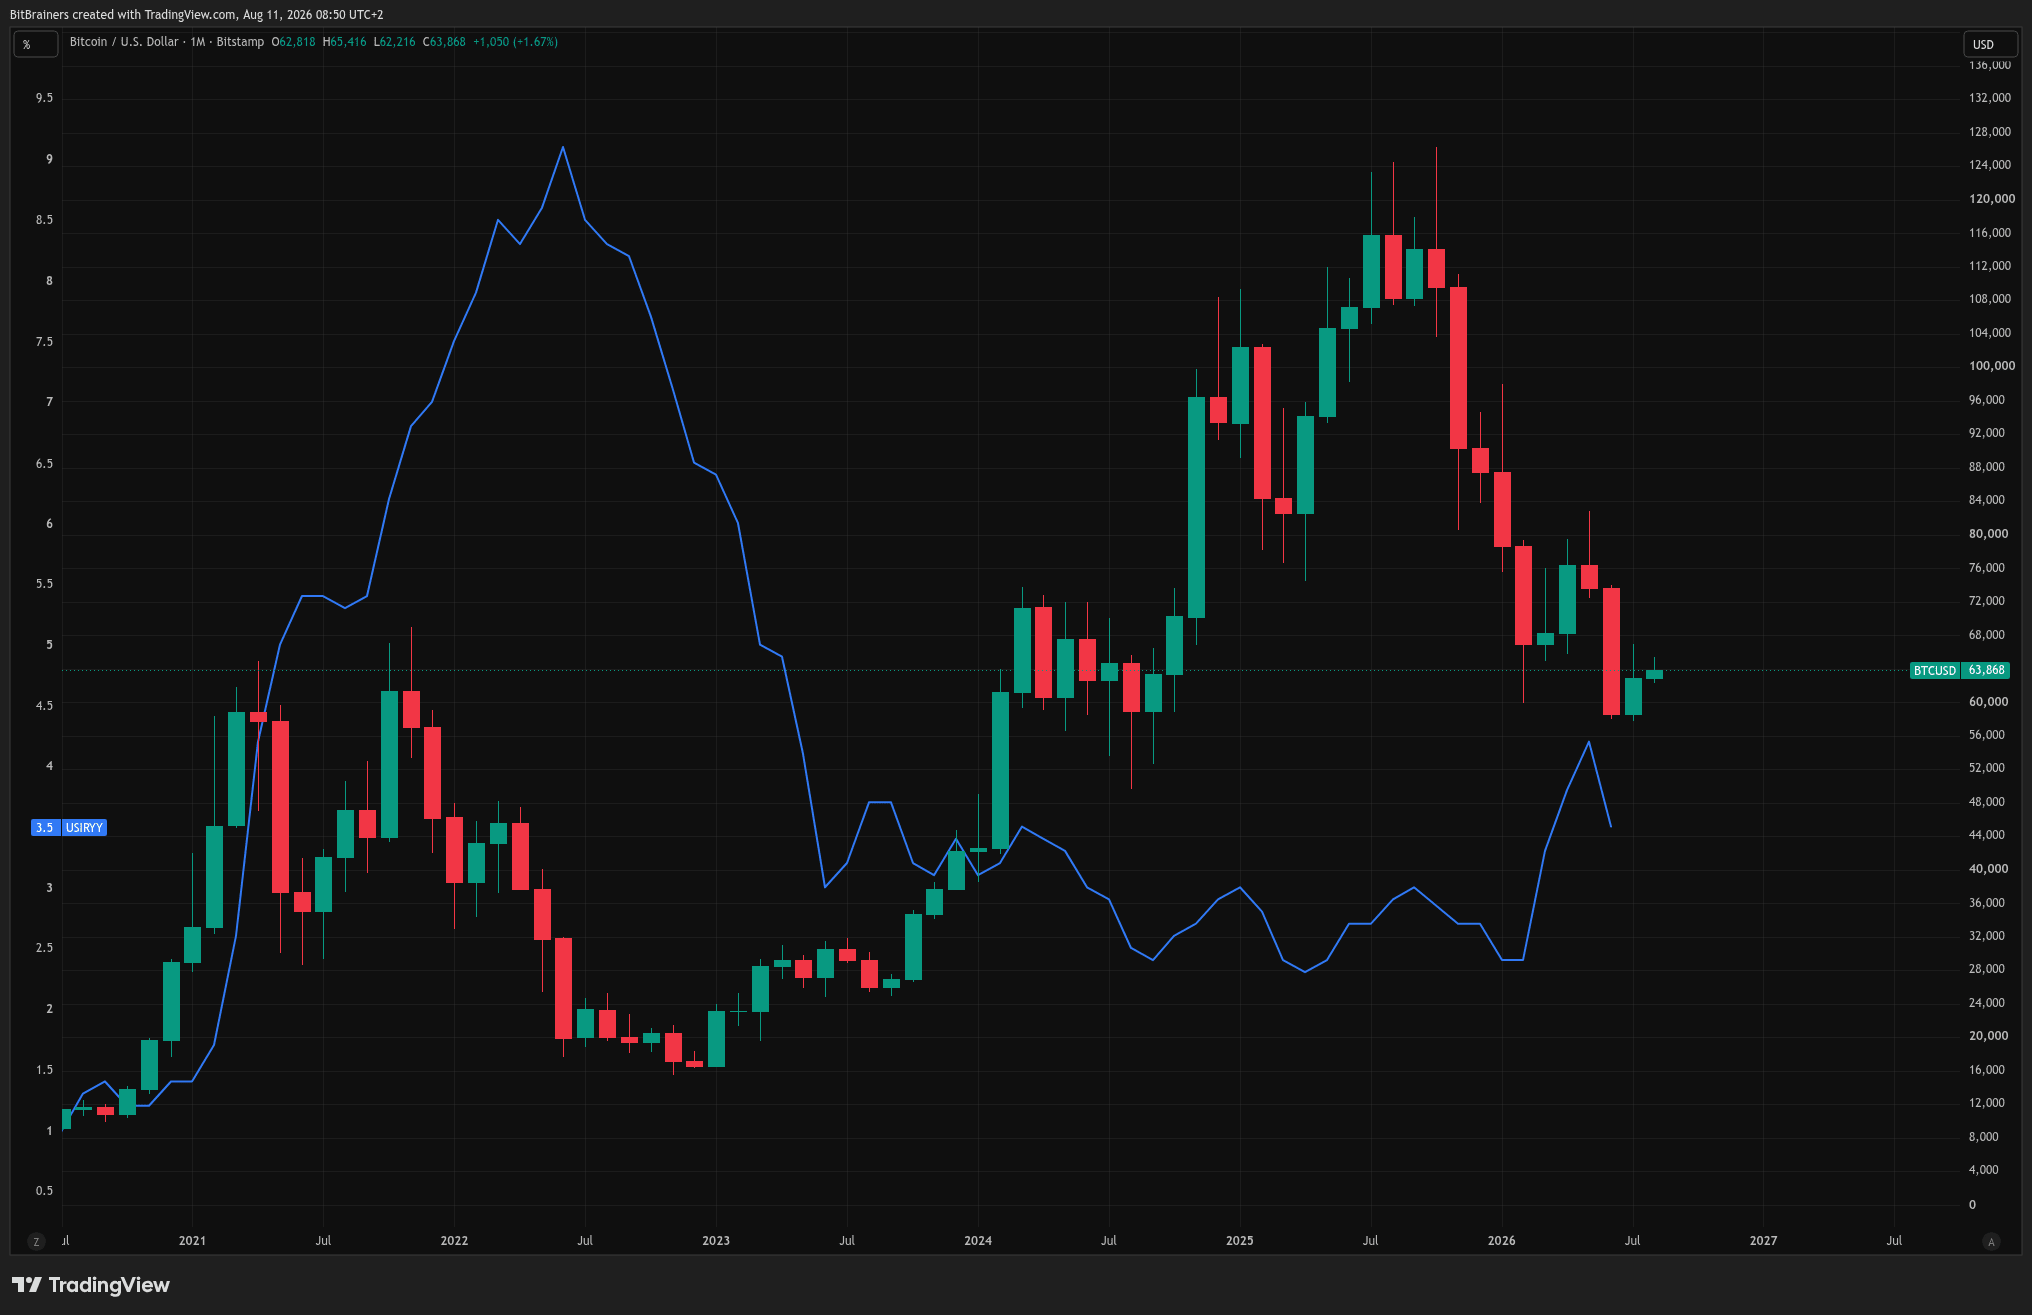
BTC/USD vs US CPI YoY (USIRYY), monthly. BitBrainers via TradingView, Aug 2026.
By BitBrainers Editorial
Every Bitcoin pitch eventually arrives at the same line: it's a hedge against inflation. Fixed supply, no central bank, 21 million cap. The argument borrows gold's playbook and assumes the same rules apply.
The chart above is worth staring at before accepting that framing.
The Part of the Argument That Is Actually True
The structural case for Bitcoin as a long-run store of value is real. The 21 million cap is not a marketing claim. It is enforced at the protocol level, and no government decision changes it. Every major fiat currency in history has been expanded by whoever controls the printing mechanism. Bitcoin cannot be..
Investors who bought in 2017 and held through 2021 saw returns that made CPI irrelevant as a comparison. The scarcity argument held up over that window. The problem comes when the word "hedge" gets attached to it. A hedge implies a specific mechanical relationship: when the thing you're hedging against rises, the hedge rises with it.
Bitcoin has not reliably done that. It did the opposite in the one period where the test actually mattered.
What Happened in 2022
US CPI peaked at 9.1% in June 2022, the highest reading since 1981. Bitcoin that month was trading below $20,000, down roughly 70% from its November 2021 high. The blue line in the chart above rises steadily through 2022. The candles collapse.
Gold fell too during 2022, though far less dramatically, and it recovered faster. The assets that genuinely performed as inflation hedges in that environment were energy, agricultural commodities, and real assets with direct pricing power tied to what was actually causing the inflation. Bitcoin was not in that category.
It fell because it had been trading as a risk asset. During the 2022 rate hiking cycle, Bitcoin's 90-day rolling correlation with the S&P 500 consistently ran above 0.65, peaking above 0.75 in mid-2022 per Bloomberg data. Gold's equity correlation over the same period stayed near zero. That single data point dismantles the "digital gold" comparison at the mechanism level, not just the surface level.
I have watched the same retail client make the inflation hedge argument in 2021, size up at $60,000, and get liquidated at $16,000 in 2022. The narrative did not change. The price did.
When the Fed started hiking and liquidity tightened, Bitcoin dropped alongside Nasdaq growth stocks. Not alongside gold. Not in the direction an inflation hedge should move.
The pattern has not shifted meaningfully since. In May 2026, CPI printed 4.2% year-on-year, the highest reading since April 2023. Bitcoin dipped roughly 2% on the release, from $62,800 to $61,500, then recovered to flat within hours. That is not a hedge behavior, thats a risk asset behavior.
Why Liquidity Drives It, Not Inflation
The 2020-2021 period is worth acknowledging here, because the narrative looked convincing then. The Fed expanded its balance sheet, rates went to zero, and Bitcoin went from $10,000 to $69,000. Inflation was rising through 2021. Bitcoin was rising. The two moved together and the "hedge" framing felt validated.
It was not inflation driving Bitcoin. It was liquidity. The Fed flooded the system with capital, that capital chased risk assets, and Bitcoin was at the top of that trade. CPI happened to be rising at the same time. The correlation was coincidental, not causal.
When the Fed reversed in 2022, the distinction became obvious. Inflation kept rising for months after the hikes started. Bitcoin stopped rising the moment liquidity conditions tightened. It was responding to the Feds balance sheet, not to CPI.
This is why global M2 money supply tracks Bitcoin's price far better than CPI does. M2 measures liquidity availability directly. Bitcoin historically lags global M2 expansion by roughly 10 to 12 weeks, which means the signal is readable in advance if you know where to look. The full breakdown of that lag and how to use it is in Bitcoin Follows M2 With a Lag Nobody Talks About.
Macro reads without the pitch
Weekly Bitcoin and macro analysis. Free. No price targets dressed up as research.
Subscribe
So What Does the Long-Run Case Actually Rest On?
Pull the short-term correlation out of the argument and a more defensible version survives. Bitcoin may be a hedge against currency debasement over decade-long horizons. That is not the same claim as hedging CPI.
Currency debasement is the structural erosion of purchasing power through sustained monetary expansion across multiple cycles. CPI is a quarterly snapshot of a basket of goods. The two are related but they diverge constantly over months and years. A fixed-supply asset plausibly protects against the first. It has not reliably protected against the second.
Most investors making the "inflation hedge" argument are thinking in one to two year windows. On that timeframe, Bitcoin has failed the test repeatedly, Gold has not. Gold does not need favorable liquidity conditions to function as a store of value. At this stage in its maturity, Bitcoin still does.
Two Things That Would Have to Change
For Bitcoin to function as a short-to-medium term inflation hedge, two conditions would need to shift.
Its equity correlation would need to break down structurally, which would require a holder base dominated by sovereign and institutional allocators treating it as a reserve asset rather than a speculative position. Spot ETF flows are moving in that direction, but the correlation data has not changed materially yet.
Its market depth would need to reach a scale where a central bank could buy meaningful quantities during an inflationary crisis without moving the price by double digits in a week. That depth does not exist at the size that matters for national reserve management.
Neither condition is impossible. Both are a long way off. Spot ETFs help, but $56 billions in cumulative inflows has not yet moved the correlation needle. Sovereign buyers are not showing up in the data.
Where That Leaves It
Bitcoin is a bet on global liquidity expansion, institutional adoption, and a fixed-supply design that may matter more in twenty years than it does today. That is a defensible position. It might even be a good one.
It is not a shortrun inflation hedge. The 2022 data makes that clear, and the chart at the top of this post shows it without requiring any argument at all.
The 21 million cap is a real property of the protocol. The inflation hedge label is a sales narrative built on top of it. Telling the difference is the first step toward writing something useful instead of something that sells. Most of the inflation hedge content online is the second kind.
Sources
Federal Reserve Bank of St. Louis: US Consumer Price Index, All Urban Consumers
Bureau of Labour Statistics via TradingView: USIRYY, United States Inflation Rate YoY
CoinGecko: Bitcoin historical price data
World Gold Council: Relevance of Gold as a Strategic Asset
This is market commentary, not financial advice. Nothing here is a recommendation to buy or sell any asset. Do your own research.