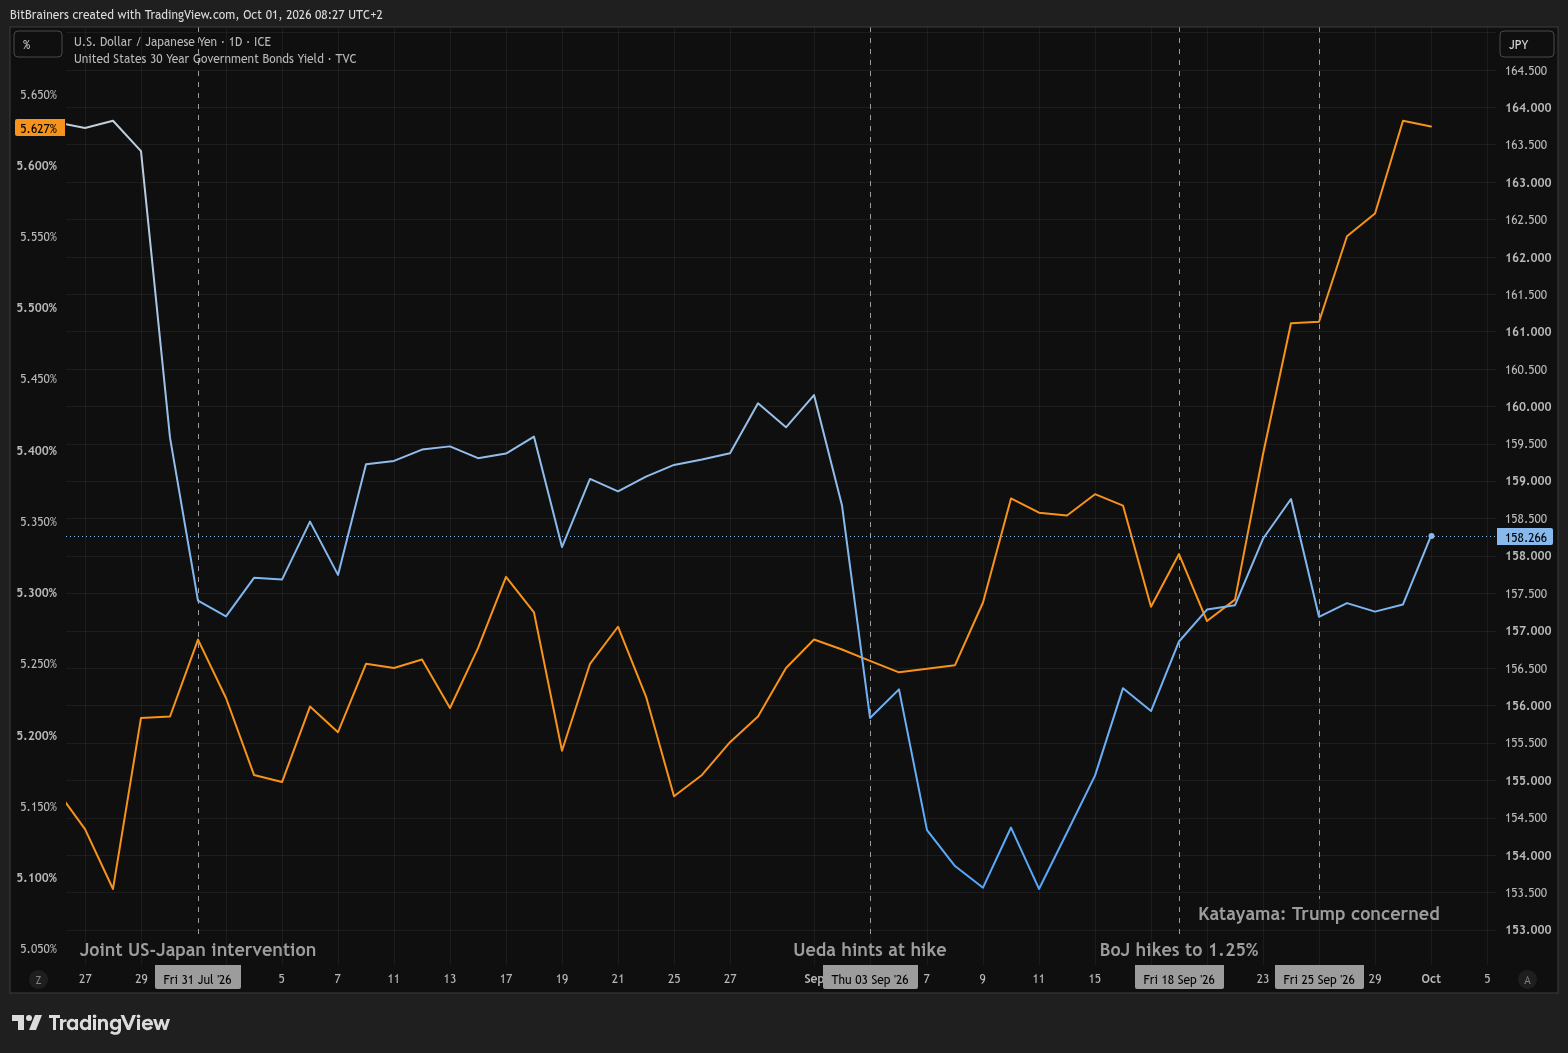
USD/JPY (light blue, right axis; higher means a weaker yen) and US 30-year Treasury yield (orange, left axis), daily, July 22 to October 1, 2026. Source: TradingView (ICE, TVC). Chart: BitBrainers.

USD/JPY (light blue, right axis; higher means a weaker yen) and US 30-year Treasury yield (orange, left axis), daily, July 22 to October 1, 2026. Source: TradingView (ICE, TVC). Chart: BitBrainers.
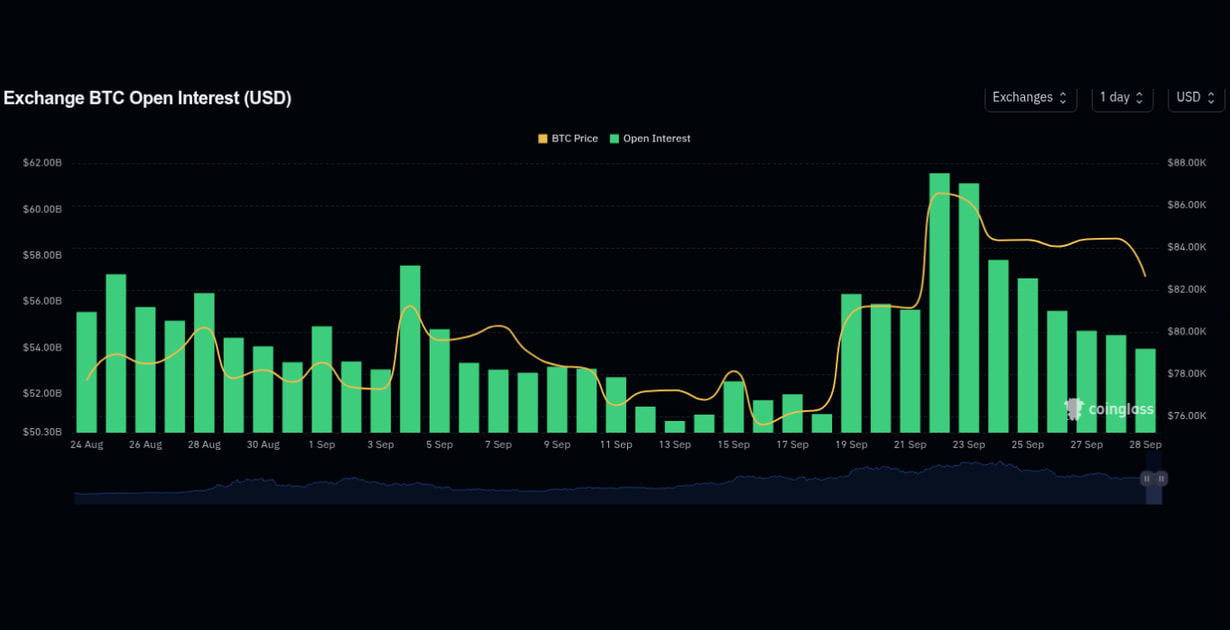
Bitcoin futures open interest, CoinGlass, late Aug to Sep 28, 2026. Peaked near $61.5B on Sep 22, stepped down through the pullback. Source: CoinGlass.

Illustration: a crude tanker on Gulf water. The strait Iran mined in February carries a fifth of the world's oil.
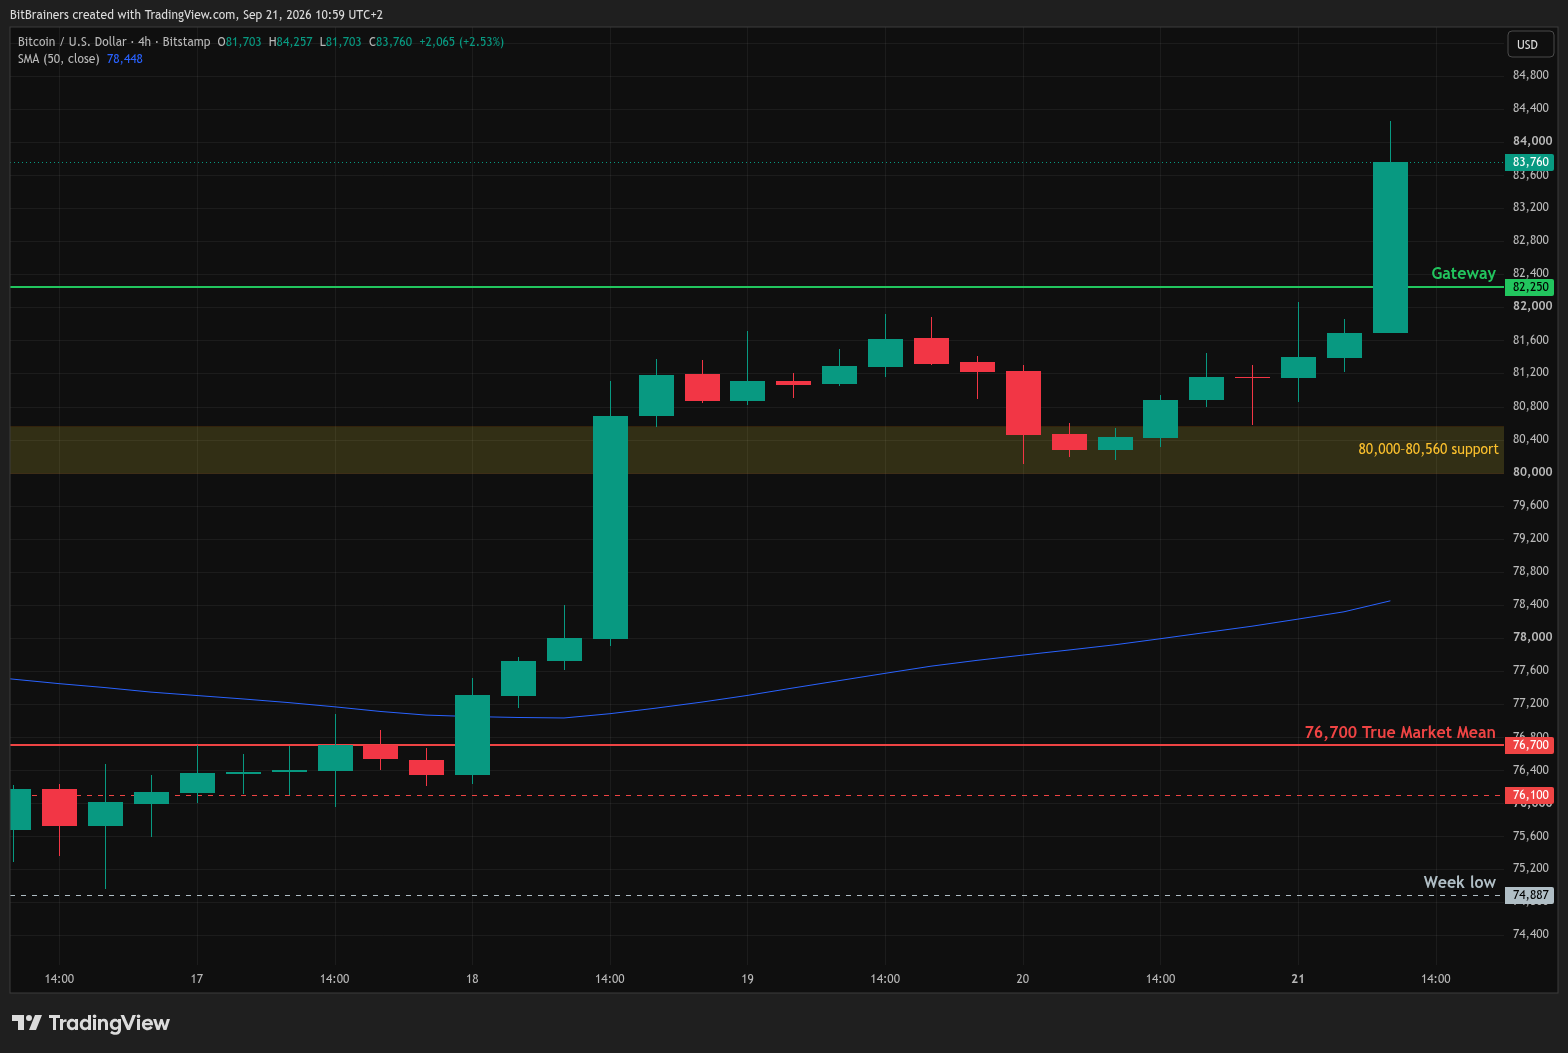
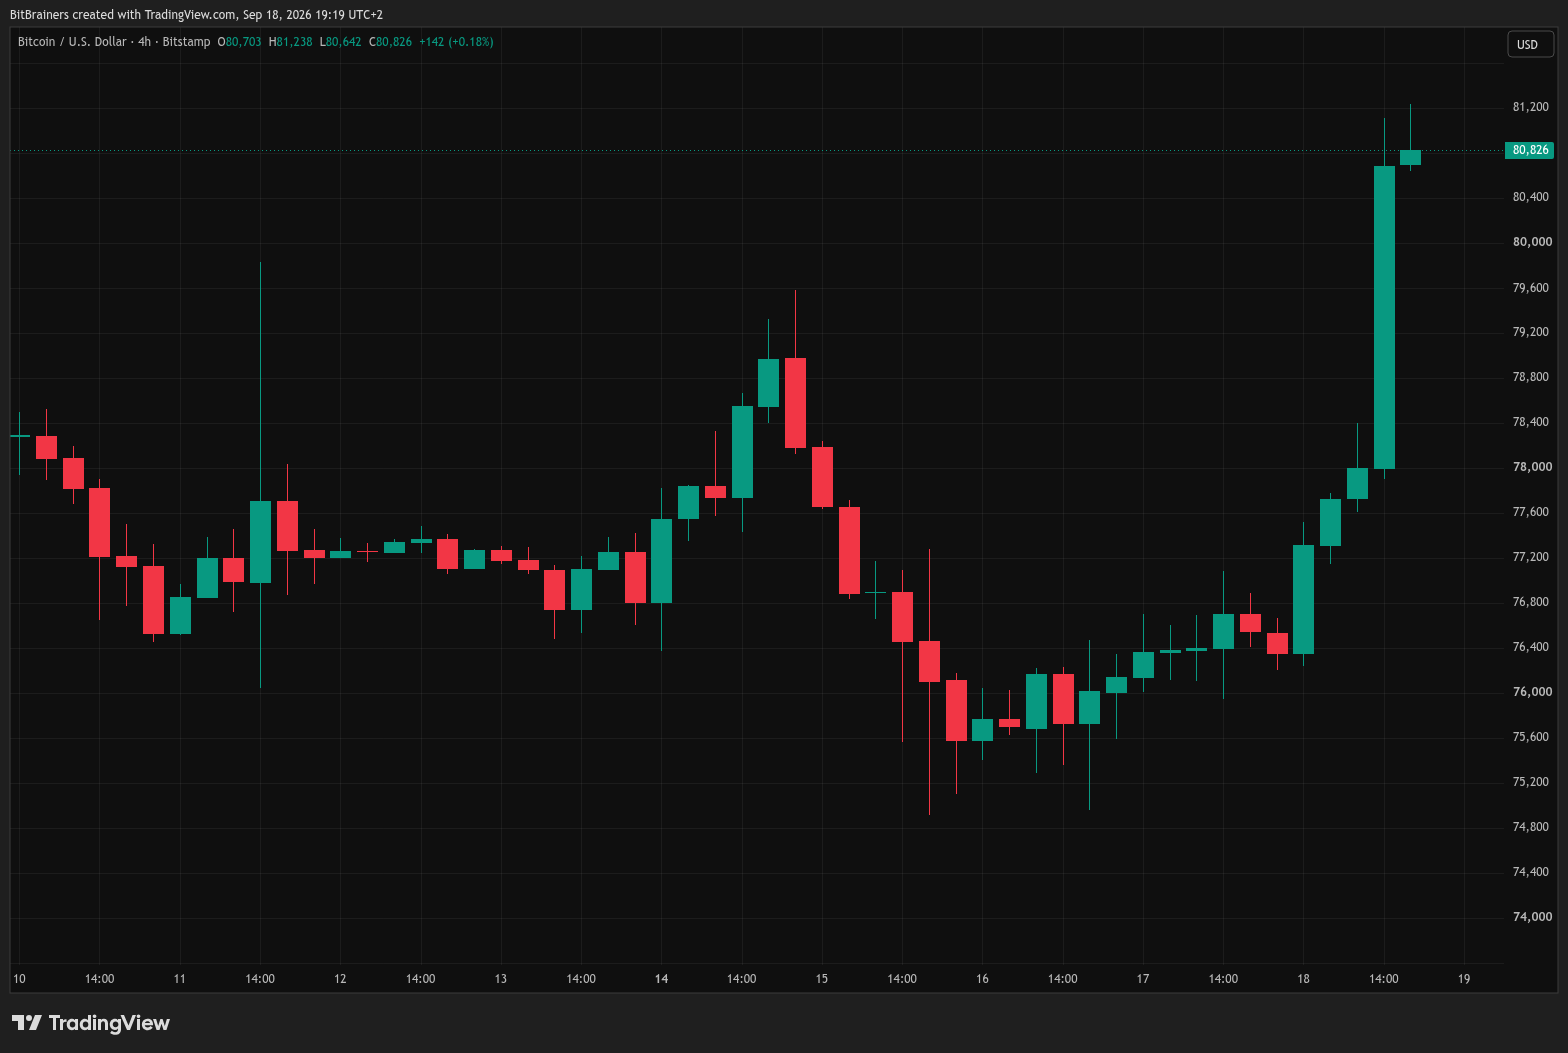
BTC/USD 4h, Bitstamp. The 14:00 candle closed at 80,683 after a high of 81,113. Source: TradingView.
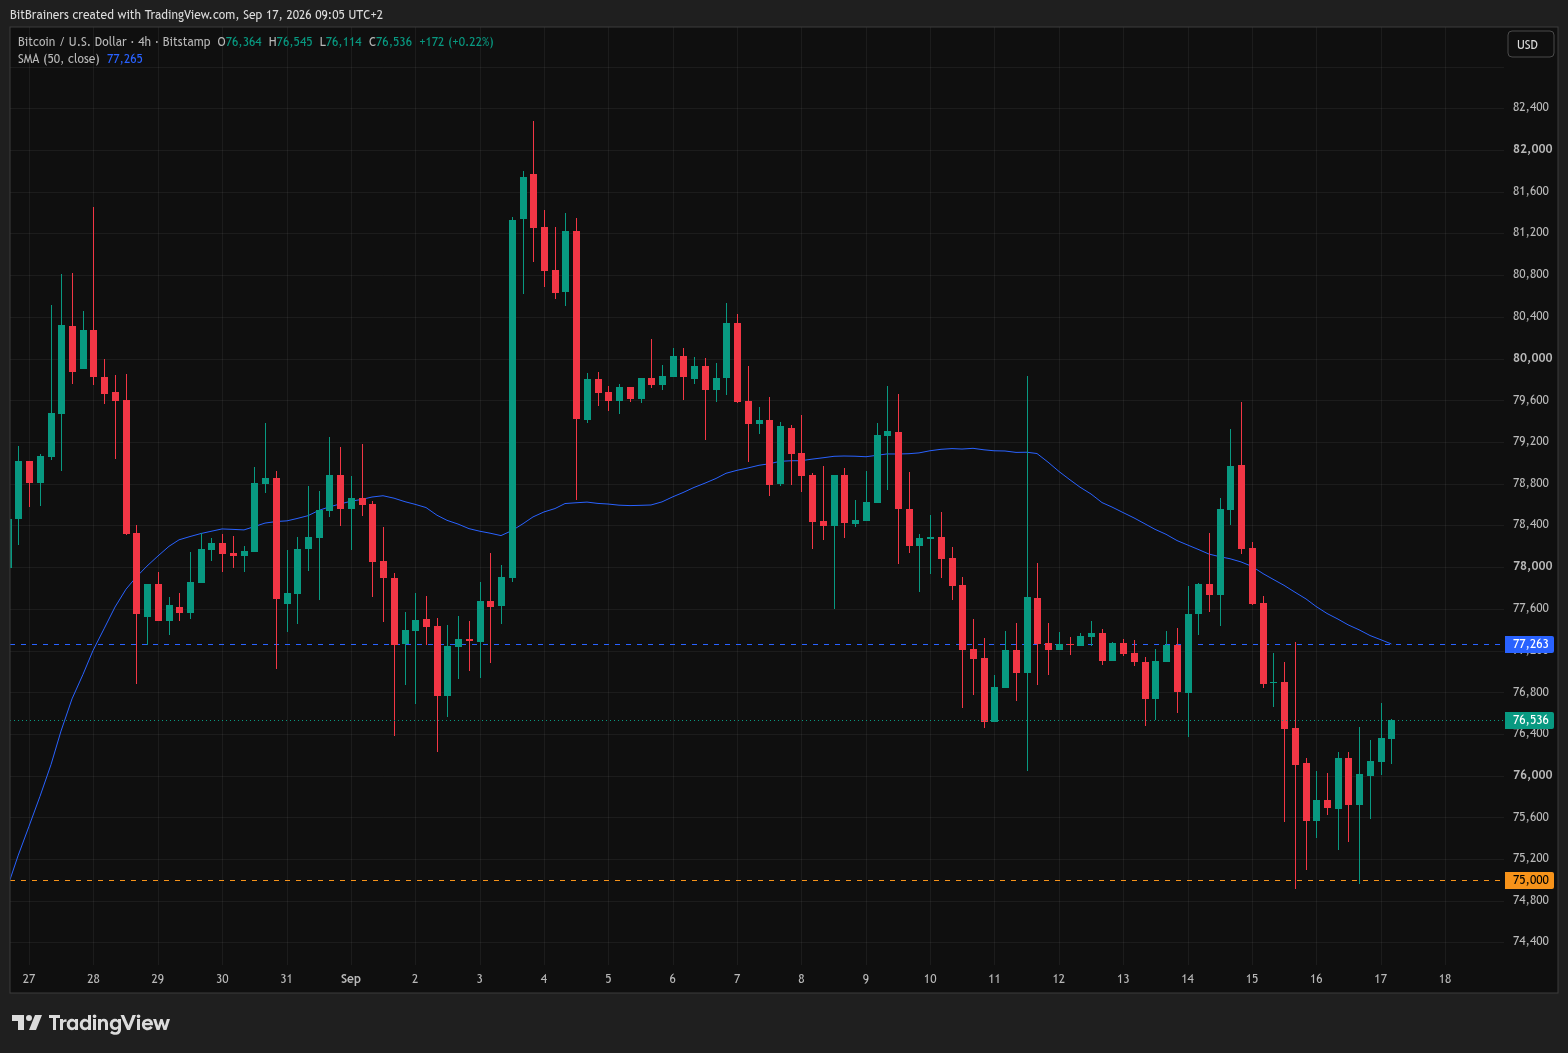
BTCUSD 4H, Bitstamp. SMA(50) at $77,263. Last $76,536. Shelf held. Average still overhead. Chart: BitBrainers via TradingView.
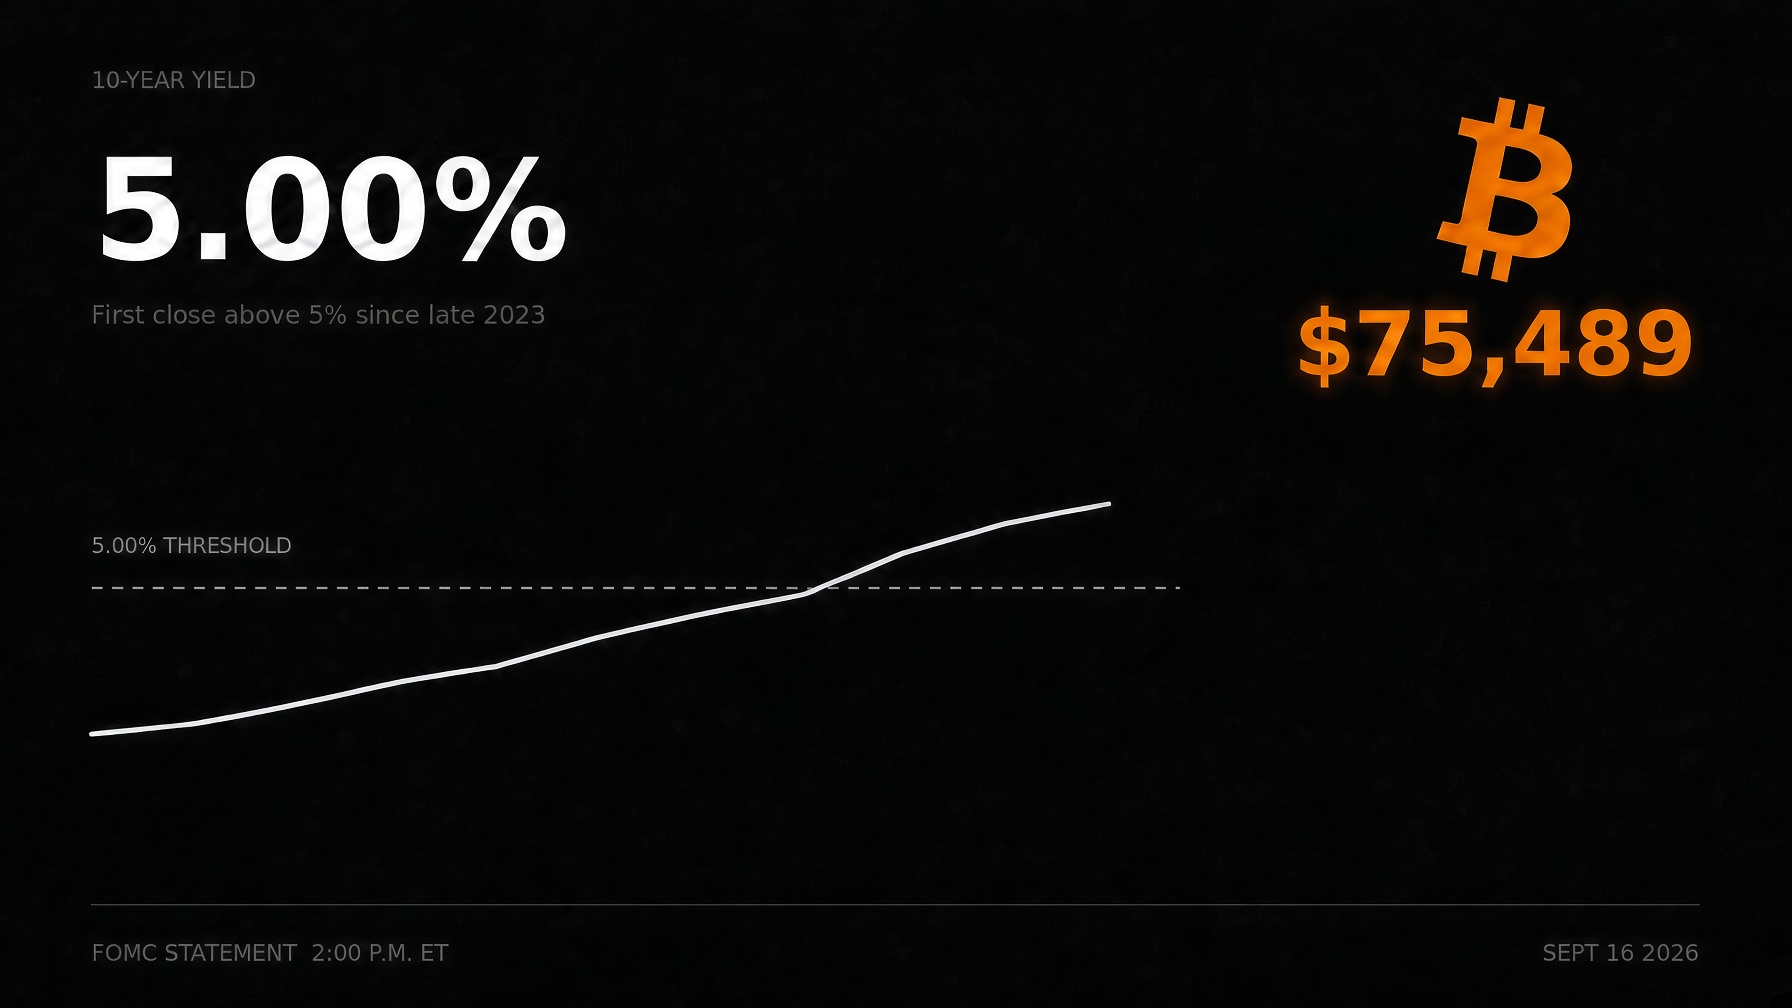
10-year Treasury yield at 5.00%, BTC at $75,489. FOMC statement 2:00 p.m. ET, September 16, 2026.

"US Capitol west side at dusk" by Martin Falbisoner, CC BY-SA 3.0, via Wikimedia Commons.


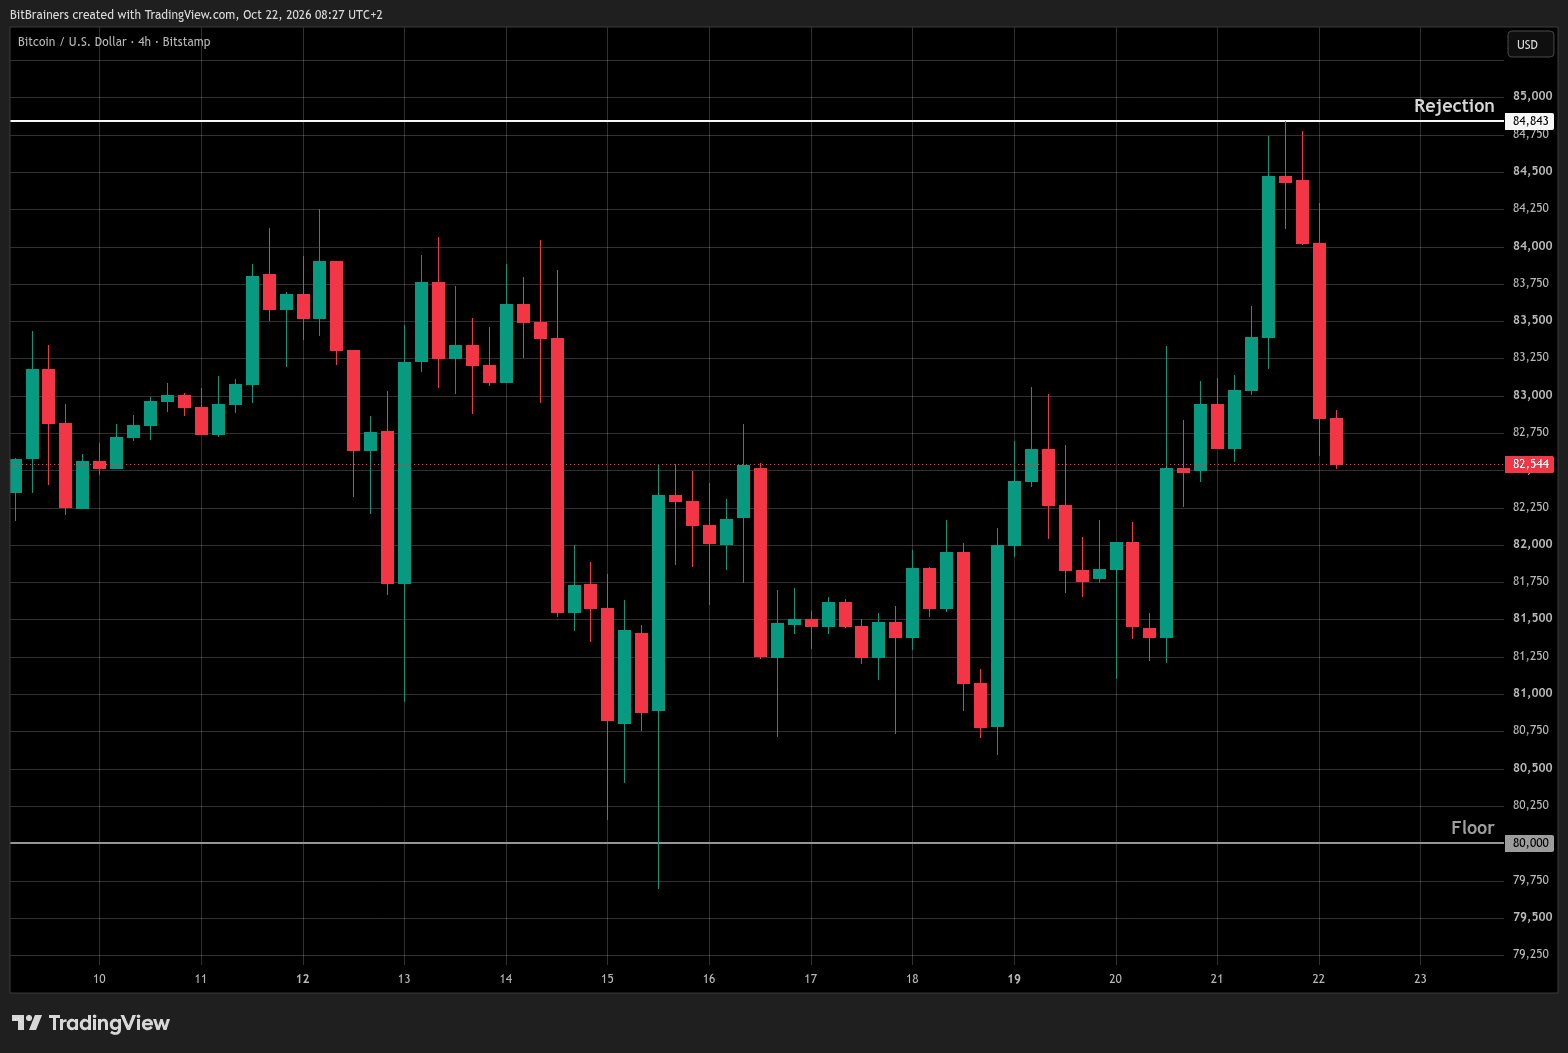
Bitcoin 4H chart, rejection at $84,800, October 2026. Source: TradingView (Bitstamp). Chart: BitBrainers.